Retail Is Leaving Bitcoin: What Happened Last Time?

Data shows the Bitcoin Retail Investor Demand Change has turned negative, a sign that the small hands are losing interest in the cryptocurrency.
Bitcoin Retail Volume Has Gone Down Over The Past Month
In a new post on X, CryptoQuant community analyst Maartunn has talked about the latest trend in the Bitcoin Retail Investor Demand Change, which is an on-chain indicator that measures the 30-day change in the demand of the retail holders.
The retail investors are the smallest of entities on the network. As such, the size of their transfers tends to be small as well. The Retail Investor Demand Change makes use of the transaction volume associated with transfers carrying a value of less than $10,000 as a proxy for the demand among this cohort.
When the value of the metric is positive, it means the retail investor volume has witnessed an increase over the past month. On the other hand, it being under zero suggests this group has lowered its activity.
Now, here is a chart that shows the trend in the Bitcoin Retail Investor Demand Change over the last few years:
The value of the metric appears to have dipped into the red zone in recent days | Source: @JA_Maartun on X
As displayed in the above graph, the Bitcoin Retail Investor Demand Change spiked to a notable positive level earlier, but since the asset’s all-time high (ATH) above $124,000, the metric’s value has fallen off fast and has now dipped into the negative zone.
The current value of the indicator suggests the transaction volume associated with transfers valued at less than $10,000 has dropped by around 5.7% over the past month. Thus, it seems the retail investors are leaving the cryptocurrency.
“They’re the tourists of the crypto market here for the hype, gone when it fades,” notes Maartunn. The latest flip in retail sentiment has come as the Bitcoin price has declined by around 10% since the ATH.
From the chart, it’s visible that the last time the Retail Investor Demand Change fell into the negative region was around the time of BTC’s dip under $100,000 back in June. What followed this bearish sentiment among the small hands was a surge in the asset to new ATHs. It now remains to be seen whether hype fading among the retail investors would act as a contrarian signal for the cryptocurrency this time as well.
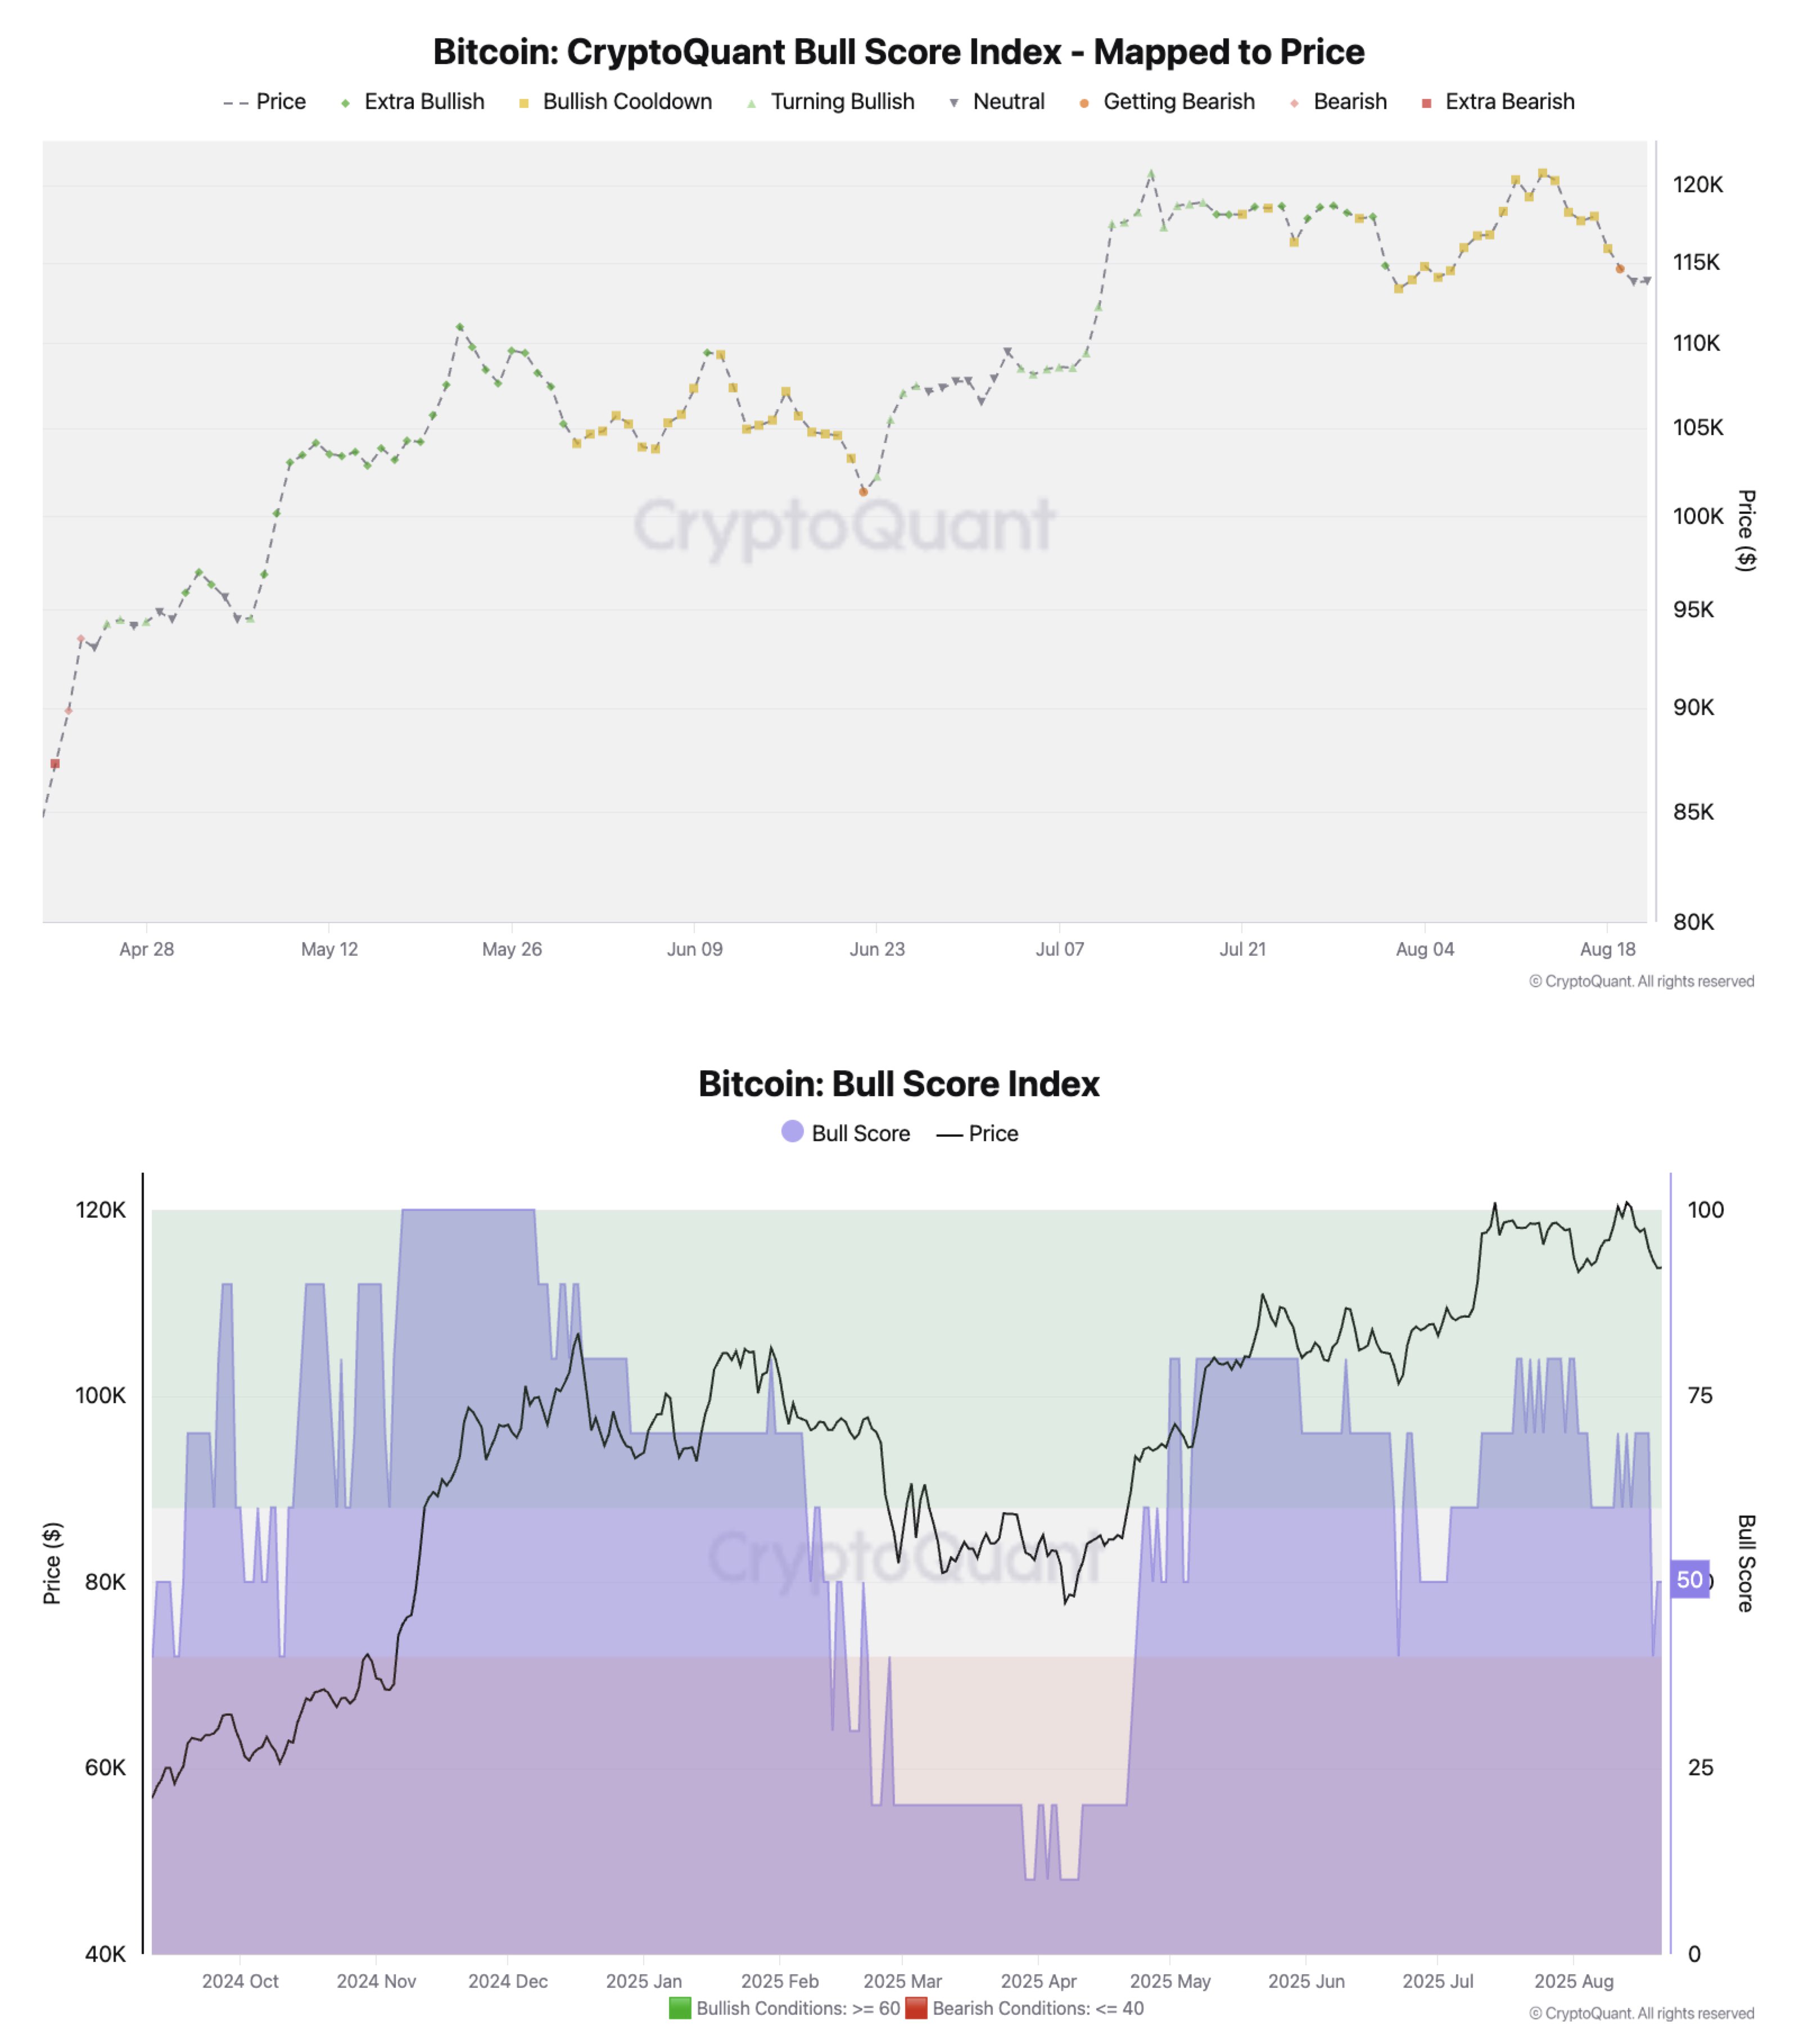
In some other news, CryptoQuant’s Bull Score Index, which tells us about the phase BTC is in based on various on-chain indicators, has declined into the neutral region recently, as the analytics firm’s head of research, Julio Moreno, has pointed out in an X post.
The trend in the BTC Bull Score Index over the past year | Source: @jjcmoreno on X
“For risk management purposes, further softening in the index indicates price could go lower,” explains Moreno.
BTC Price
Bitcoin has seen its drawdown deepen during the past day as its price has slipped under $112,300.
Looks like the price of the coin has been sliding down during the last few days | Source: BTCUSDT on TradingView
Featured image from Dall-E, CryptoQuant.com, chart from TradingView.com

Editorial Process for bitcoinist is centered on delivering thoroughly researched, accurate, and unbiased content. We uphold strict sourcing standards, and each page undergoes diligent review by our team of top technology experts and seasoned editors. This process ensures the integrity, relevance, and value of our content for our readers.

