Is ETH About to Break Above $2.6K at Last?
Ethereum is in a crucial phase, with an inverted head and shoulders pattern forming on the daily chart and a double-bottom pattern on the 4-hour chart, both pointing toward the possibility of a slight bullish reversal.
The $2.7K neckline and $2.1K support level will be key areas to watch, as a breakout or breakdown will determine the next primary direction.
By Shayan
The Daily Chart
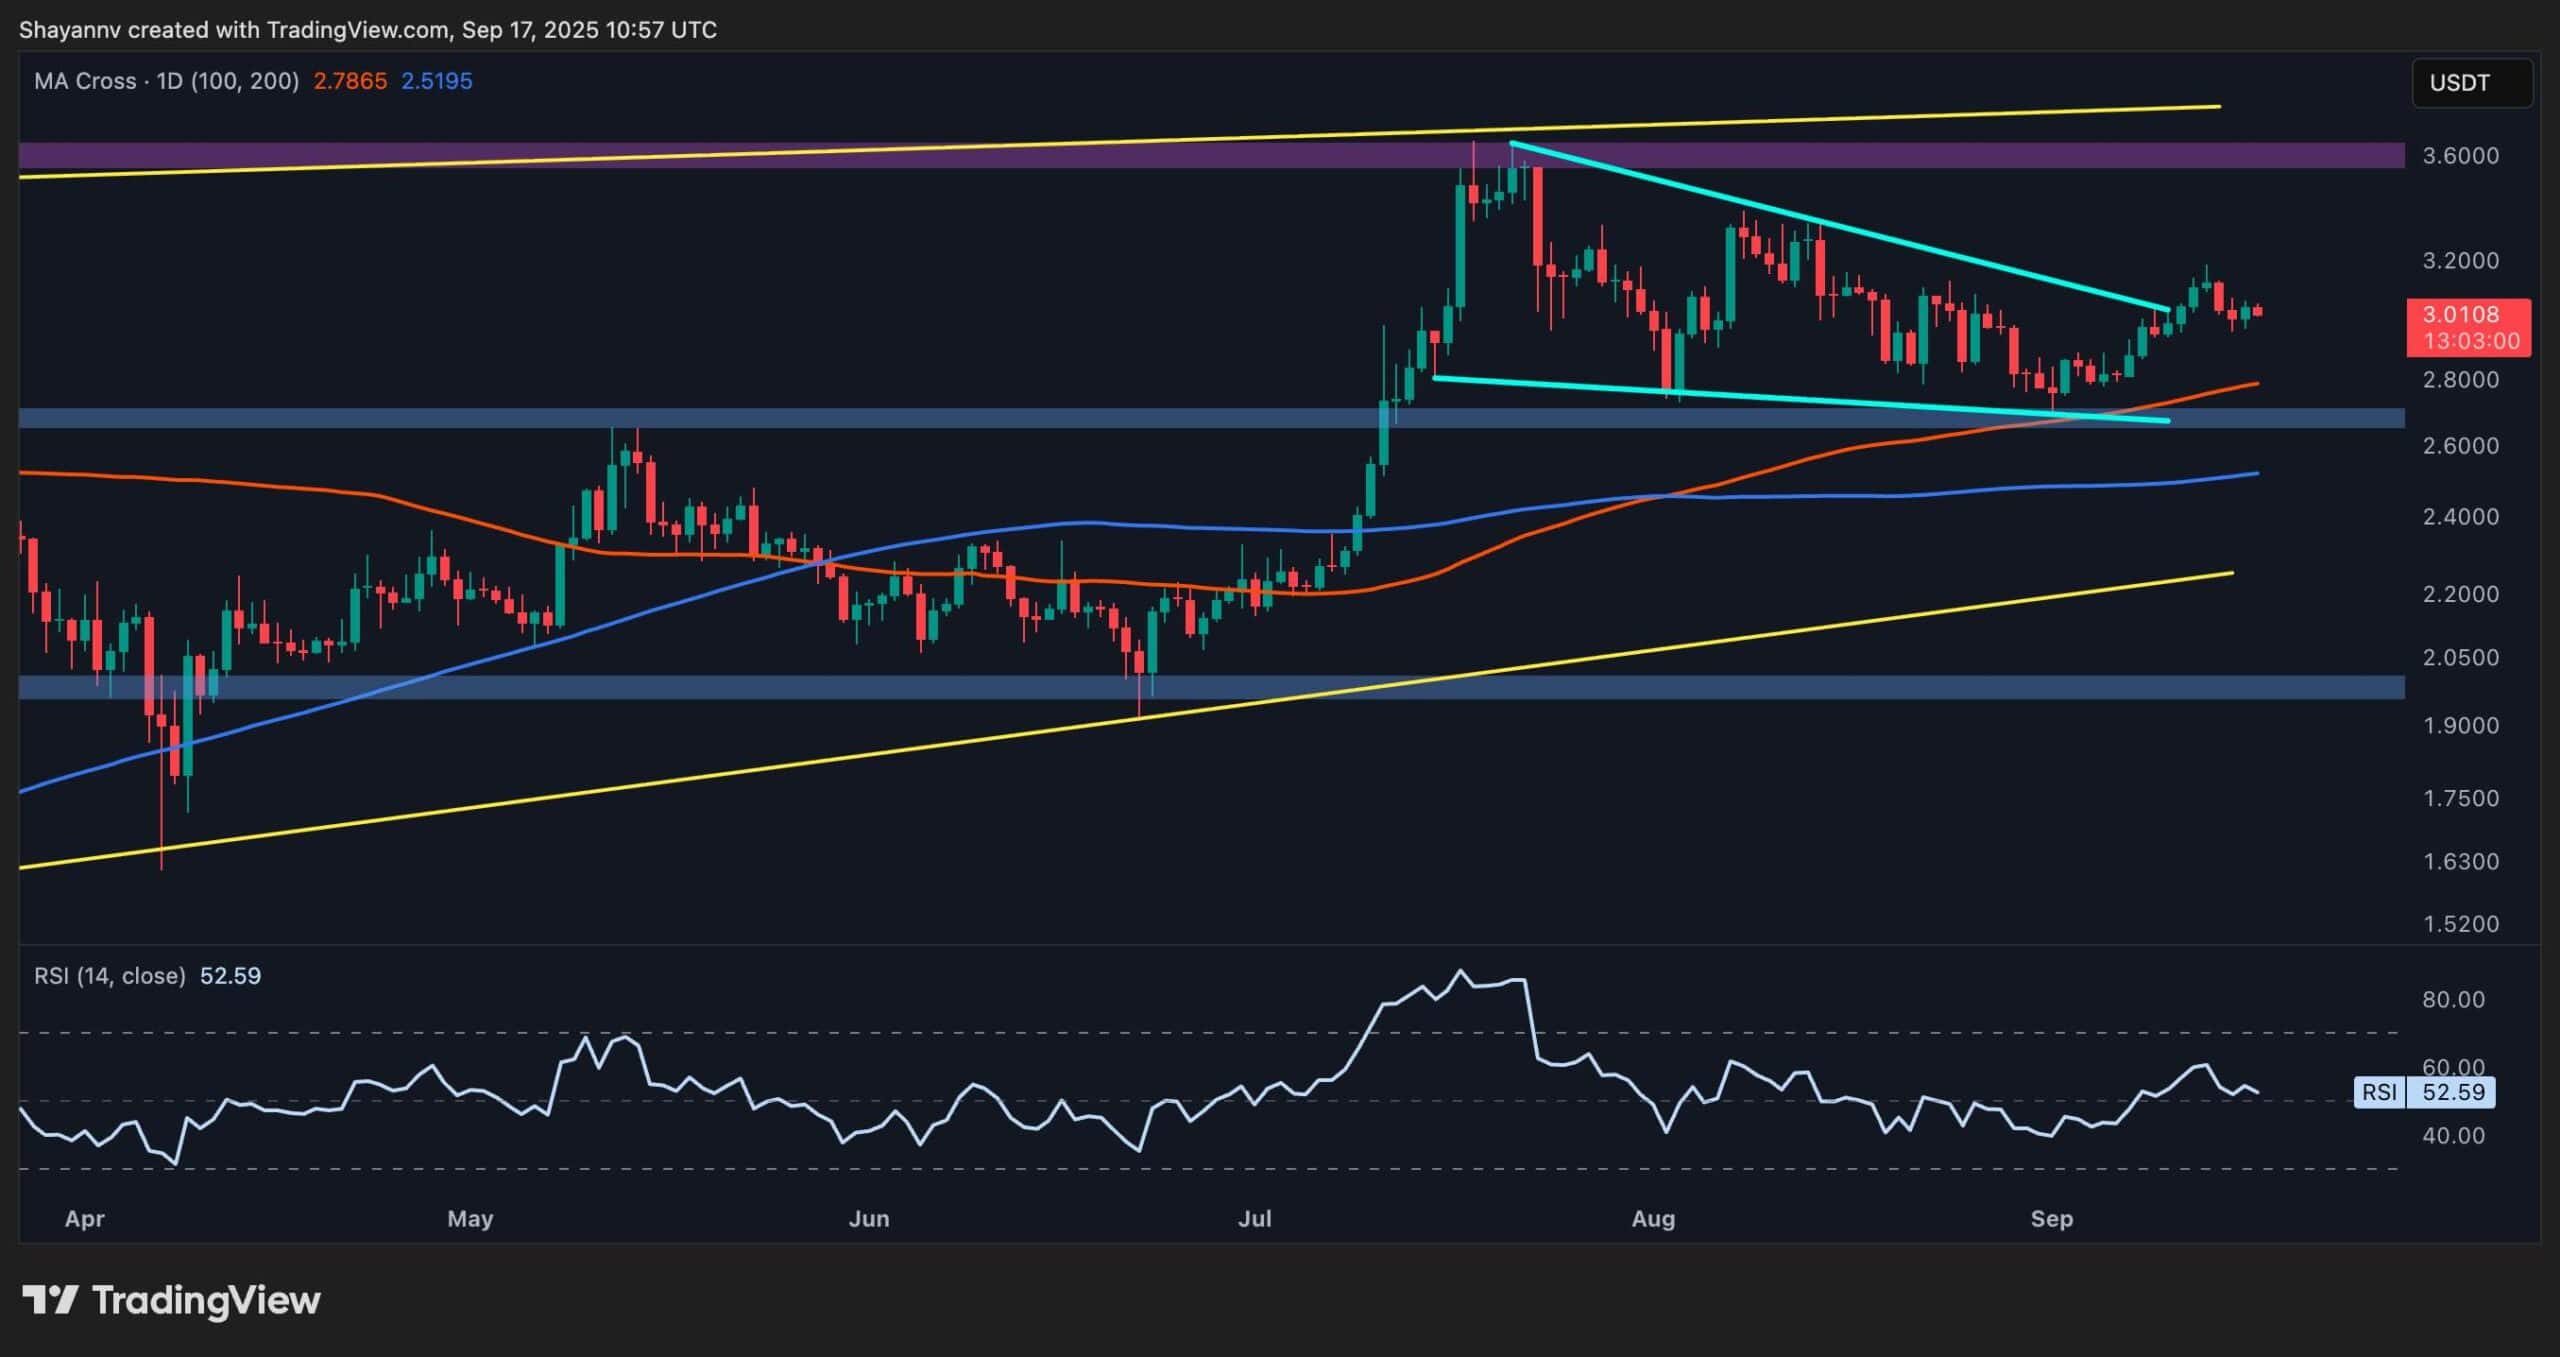
Ethereum is undergoing a descending consolidation phase, with no clear directional bias emerging recently. However, an important inverted head and shoulders pattern has formed near the $2.1K support zone, a critical level where buyers have managed to hold ground.
This pattern is typically a bullish reversal signal, suggesting that a shift towards upward momentum may be on the horizon, particularly if ETH can break through the neckline, which is around $2.7K.
Ethereum has roughly reclaimed the midpoint of the multi-month channel, which lies around $2.5K. If this breakout turns out to be valid, buyers’ next focus will shift to the neckline of the inverted head-and-shoulders pattern at $2.7K. A breakthrough at this level could solidify a bullish reversal, potentially targeting the $3K resistance zone in the near term.
The 4-Hour Chart
On the 4-hour chart, Ethereum sellers have struggled to push the price below the ascending flag pattern’s lower boundary, which sits near $2.3K. This dynamic support level has been tested multiple times, and a breach here could trigger a long-squeeze event, sending the price rapidly down to the $2.1K support region. However, Ethereum has also formed a double-bottom pattern in this timeframe, which typically signals a short-term bullish reversal.
The price is currently confined between the ascending flag’s support and a critical resistance zone defined by the 0.5 Fibonacci level at $2.6K and the 0.618 Fibonacci level at $2.8K. Ethereum will likely continue consolidating within this tight range until a decisive breakout, either upward or downward, occurs.
By Shayan
Ethereum is currently trapped within a price range between $2.1K and $2.7K, and a detailed look at the Binance liquidation heatmap reveals the key liquidity zones that could influence an impending breakout. The heatmap displays regions of concentrated liquidity, such as stop-loss orders and liquidation levels, which are predominantly driven by more significant market participants, including whales.
The cryptocurrency faces a period of slight consolidation with minimal volatility, reflecting the equilibrium between buyers and sellers. On the downside, the $2K region is heavily defended by whales and institutional traders, as evidenced by significant liquidity pools concentrated in this area. On the other hand, the $2.8K resistance zone represents a formidable barrier, as it holds a significant amount of liquidity.
This liquidity concentration suggests that many traders, particularly large ones, have placed their liquidation points around this price level, making it critical. A breakout in either direction could lead to a liquidation cascade, triggering a chain reaction of stop-loss orders and liquidations that could amplify the prevailing trend.
Binance Free $600 (CryptoPotato Exclusive): Use this link to register a new account and receive $600 exclusive welcome offer on Binance (full details).
LIMITED OFFER 2024 at BYDFi Exchange: Up to $2,888 welcome reward, use this link to register and open a 100 USDT-M position for free!
Disclaimer: Information found on CryptoPotato is those of writers quoted. It does not represent the opinions of CryptoPotato on whether to buy, sell, or hold any investments. You are advised to conduct your own research before making any investment decisions. Use provided information at your own risk. See Disclaimer for more information.
Cryptocurrency charts by TradingView.


