Popcat price slips as smart money sells, exchange balances rise
Popcat price has declined by over 40% from its highest level this year as signs of increased selling pressure emerge.
Popcat (POPCAT), the third-largest meme coin on the Solana (SOL) network, retreated to $1.0342, its lowest level since Oct. 24.
Data from Nansen shows that the volume of Popcat coins on exchanges has increased by 7.7% over the last seven days, rising to over 223.94 million. This increase brings the total supply on exchanges to about 22.8%. Most of these coins are held on exchanges like Bybit, Kraken, Gate, and Raydium.
An increase in the number of coins on exchanges is often considered a bearish signal for a cryptocurrency, as it suggests that holders may be preparing to sell.
Further Nansen data reveals that the number of smart money investors holding Popcat has dropped significantly, from 85 a few months ago to 40 today.

The total balances held by these smart money investors have decreased from 2.196 million in September to 2.17 million currently, indicating that many savvy investors are taking profits or reallocating to other cryptocurrencies.
Additional data shows that the number of Popcat holders is not growing. According to CoinCarp, it had 116,400 holders on Dec. 11, a small increase from a day earlier.
These actions are happening as traders embrace a wait-and-see approach now that cryptocurrency prices have lost momentum. Most Solana meme coins have fallen, with the market cap for these tokens dipping from $20 billion last week to $17 billion.
Popcat price technical analysis

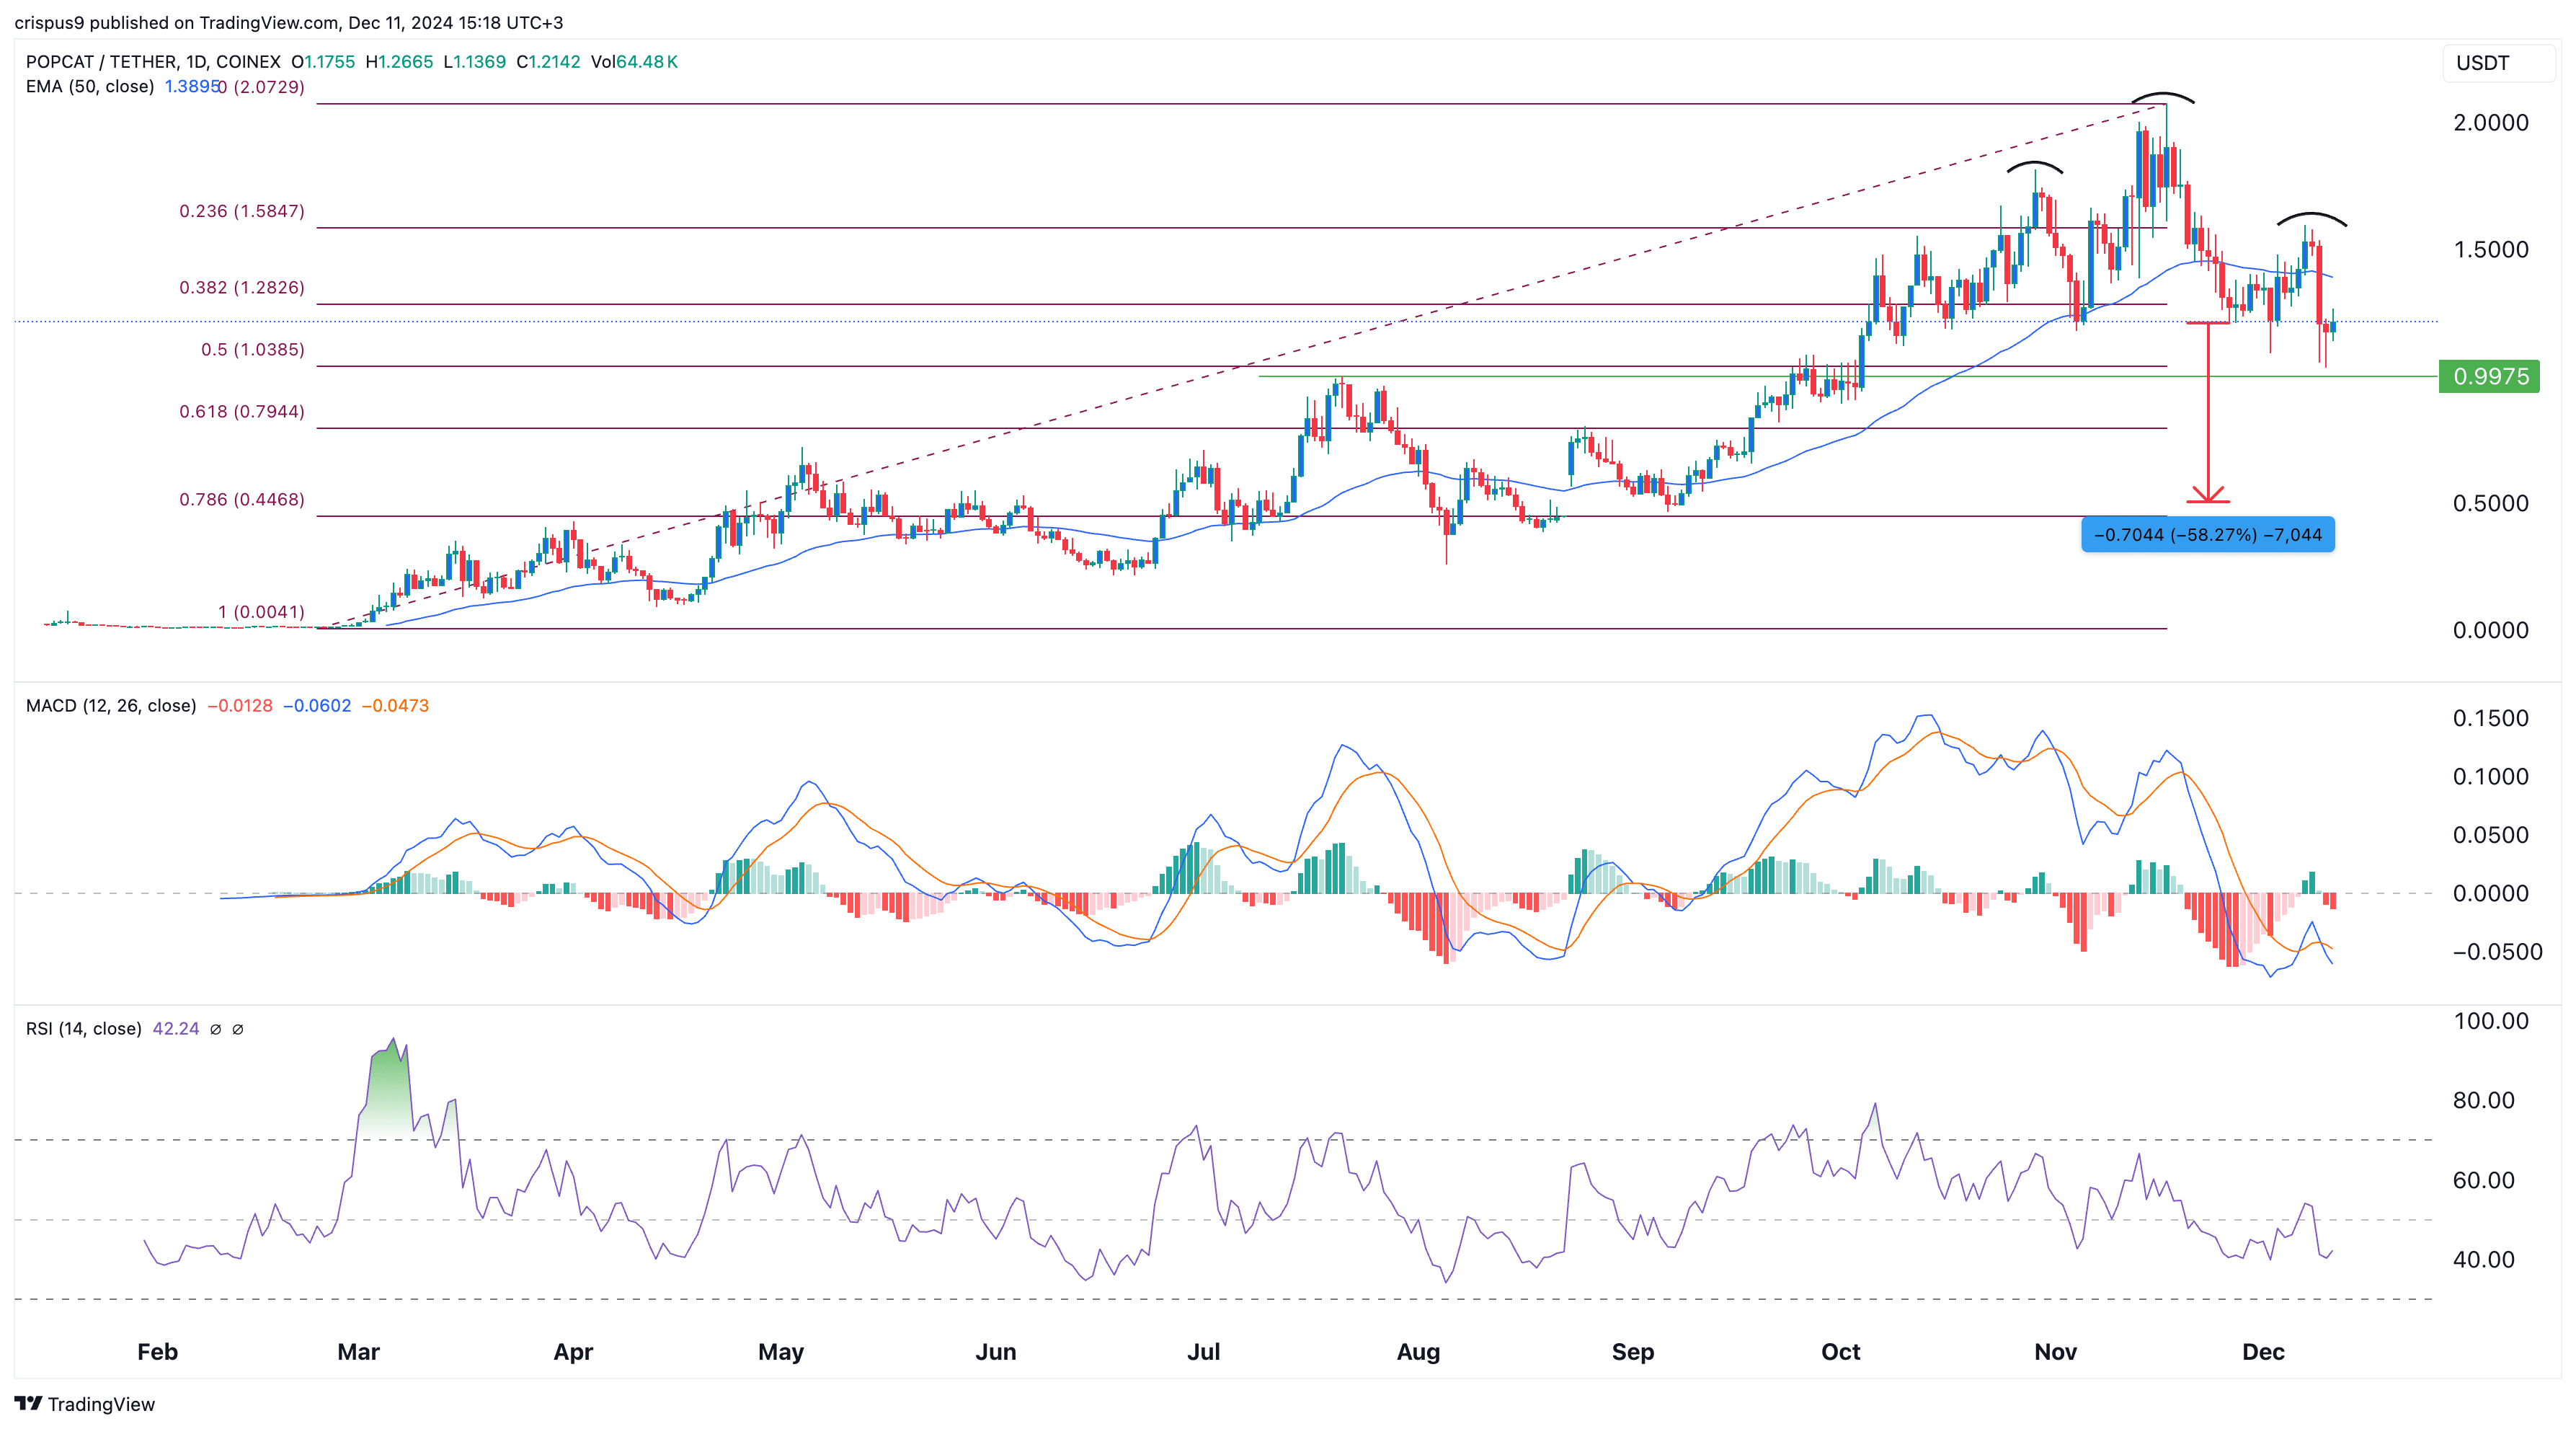
The daily chart shows that the Popcat price peaked at $2.07 on Nov. 17 before embarking on a strong sell-off. It dropped and retested the 50% Fibonacci Retracement level at $1.0385.
Popcat has also fallen below its 50-day moving average. Notably, the price action suggests the formation of a head-and-shoulders pattern, a commonly recognized bearish indicator.
The MACD and the Relative Strength Index have tilted downwards and moved below their neutral levels.
As a result, the token may continue to decline, with sellers potentially targeting the psychological level of $0.50—a drop of approximately 58% from the current price. This bearish outlook will be confirmed if the price breaks below the key support at $0.9975, its highest swing level from July.


