Bitcoin Active Addresses Spike, What Does This Mean?
On-chain data shows that Bitcoin active addresses have registered a spike recently. Here’s what this may mean for the market.
Bitcoin Active Addresses Spike Following Uptick In Volatility
According to data from the on-chain analytics firm Santiment, utility on the network has picked up quite drastically recently. The “active addresses” here refer to the Bitcoin addresses that are taking part in some kind of transaction activity on the blockchain. These addresses can be both senders and receivers.
The “daily active addresses,” an on-chain indicator, measures the total number of unique such addresses that are appearing on the network every day. By “unique,” what’s meant here is that the metric only counts every active address just once, implying that even if a wallet makes multiple transactions inside a 24-hour span, its contribution to the indicator will still remain only one unit.
The benefit of only counting unique addresses is that these unique addresses can be assumed to be individual users. Thus, whenever the daily active addresses indicator has a high value, it means that a large number of users are visiting the blockchain currently. Such a trend can be a sign that traders are active in the market right now.
On the other hand, low values of the metric imply the network is observing a low amount of activity at the moment. This kind of trend may suggest that there isn’t much interest around the coin among the general investors currently.
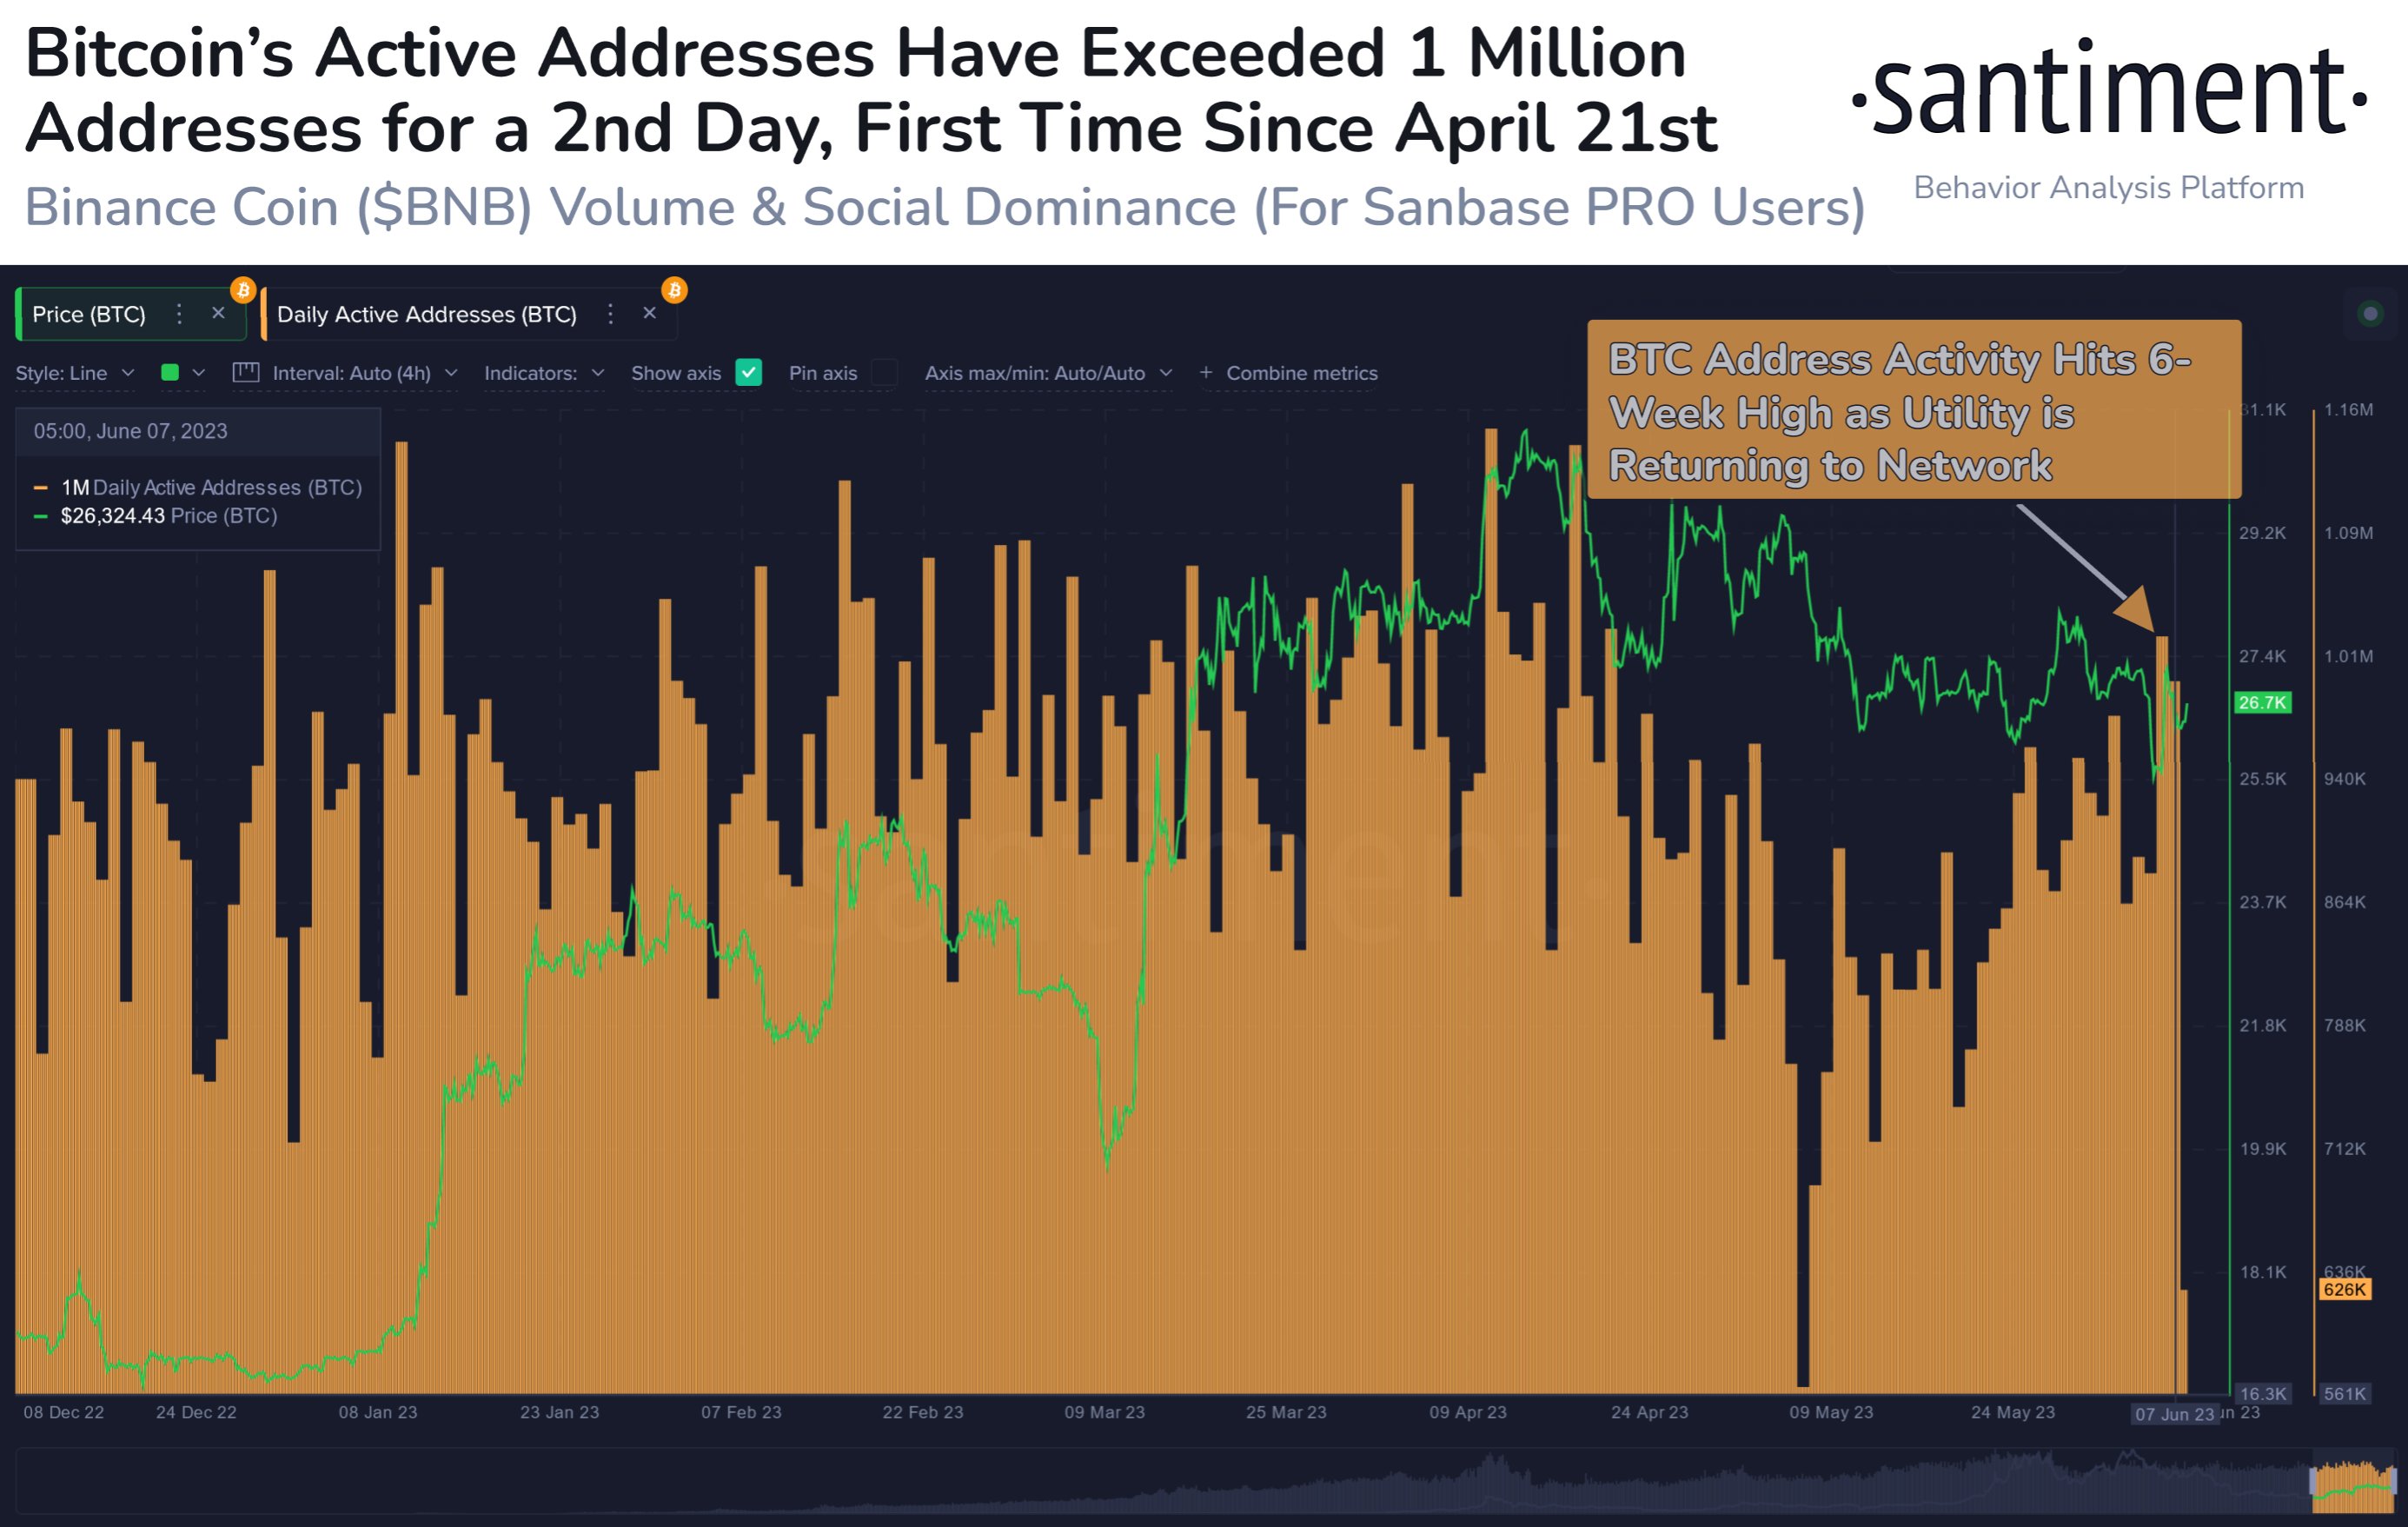
Now, here is a chart that shows the trend in the Bitcoin daily active addresses over the last half a year:
The value of the metric seems to have gone up in recent days | Source: Santiment on Twitter
As displayed in the above graph, the Bitcoin active addresses metric has shot up recently as the price of the cryptocurrency has gone through a high amount of fluctuations.
This volatility has come as the US Securities and Exchange Commission (SEC) has put regulatory scrutiny on the largest exchanges in the industry, Binance and Coinbase.
Historically, whenever the price has displayed high volatility, the active addresses indicator has usually jumped up as such wild price action can catch the attention of a large amount of investors. The holders may participate on the blockchain during these times for making panic sells or FOMO dip buys.
It would appear that the recent increase in the indicator may be fueled in part by such investors. At the peak of this spike, the indicator had surpassed the one million mark for the first time since April.
Interestingly, the metric hasn’t observed a cooldown just yet, as the number of Bitcoin active addresses has now stayed above one million for the second consecutive day.
This may imply that the latest volatility has sparked the renewal of utility of the network, meaning that investors are actively making use of the blockchain for various transaction purposes now.
The Bitcoin network observing high levels of utility can be bullish in the long term, as it shows adoption and engagement from the users. In the short-term, however, it may spawn further volatility for the price, as a large number of users making transfers at once can provide the necessary fuel for sharp moves in the asset.
BTC Price
At the time of writing, Bitcoin is trading around $26,600, down 1% in the last week.
Looks like the asset has stagnated since the burst of volatility | Source: BTCUSD on TradingView
Featured image from Dmitry Demidko on Unsplash.com, charts from TradingView.com, Santiment.net

