On-chain data shows a trend in the current Bitcoin cycle that’s different from the pattern followed during the previous epochs.
More Bitcoin Has Left Exchanges During The Current Cycle So Far
According to data from the on-chain analytics firm Glassnode, the previous cycles saw the balance on exchanges register a net increase. The “balance on exchanges” here refers to the total amount of Bitcoin that’s currently sitting in the wallets of all centralized exchanges.
When the value of this metric goes up, it means the investors are depositing a net number of coins to these platforms currently. On the other hand, a decline implies that withdrawals are occurring in the market right now.
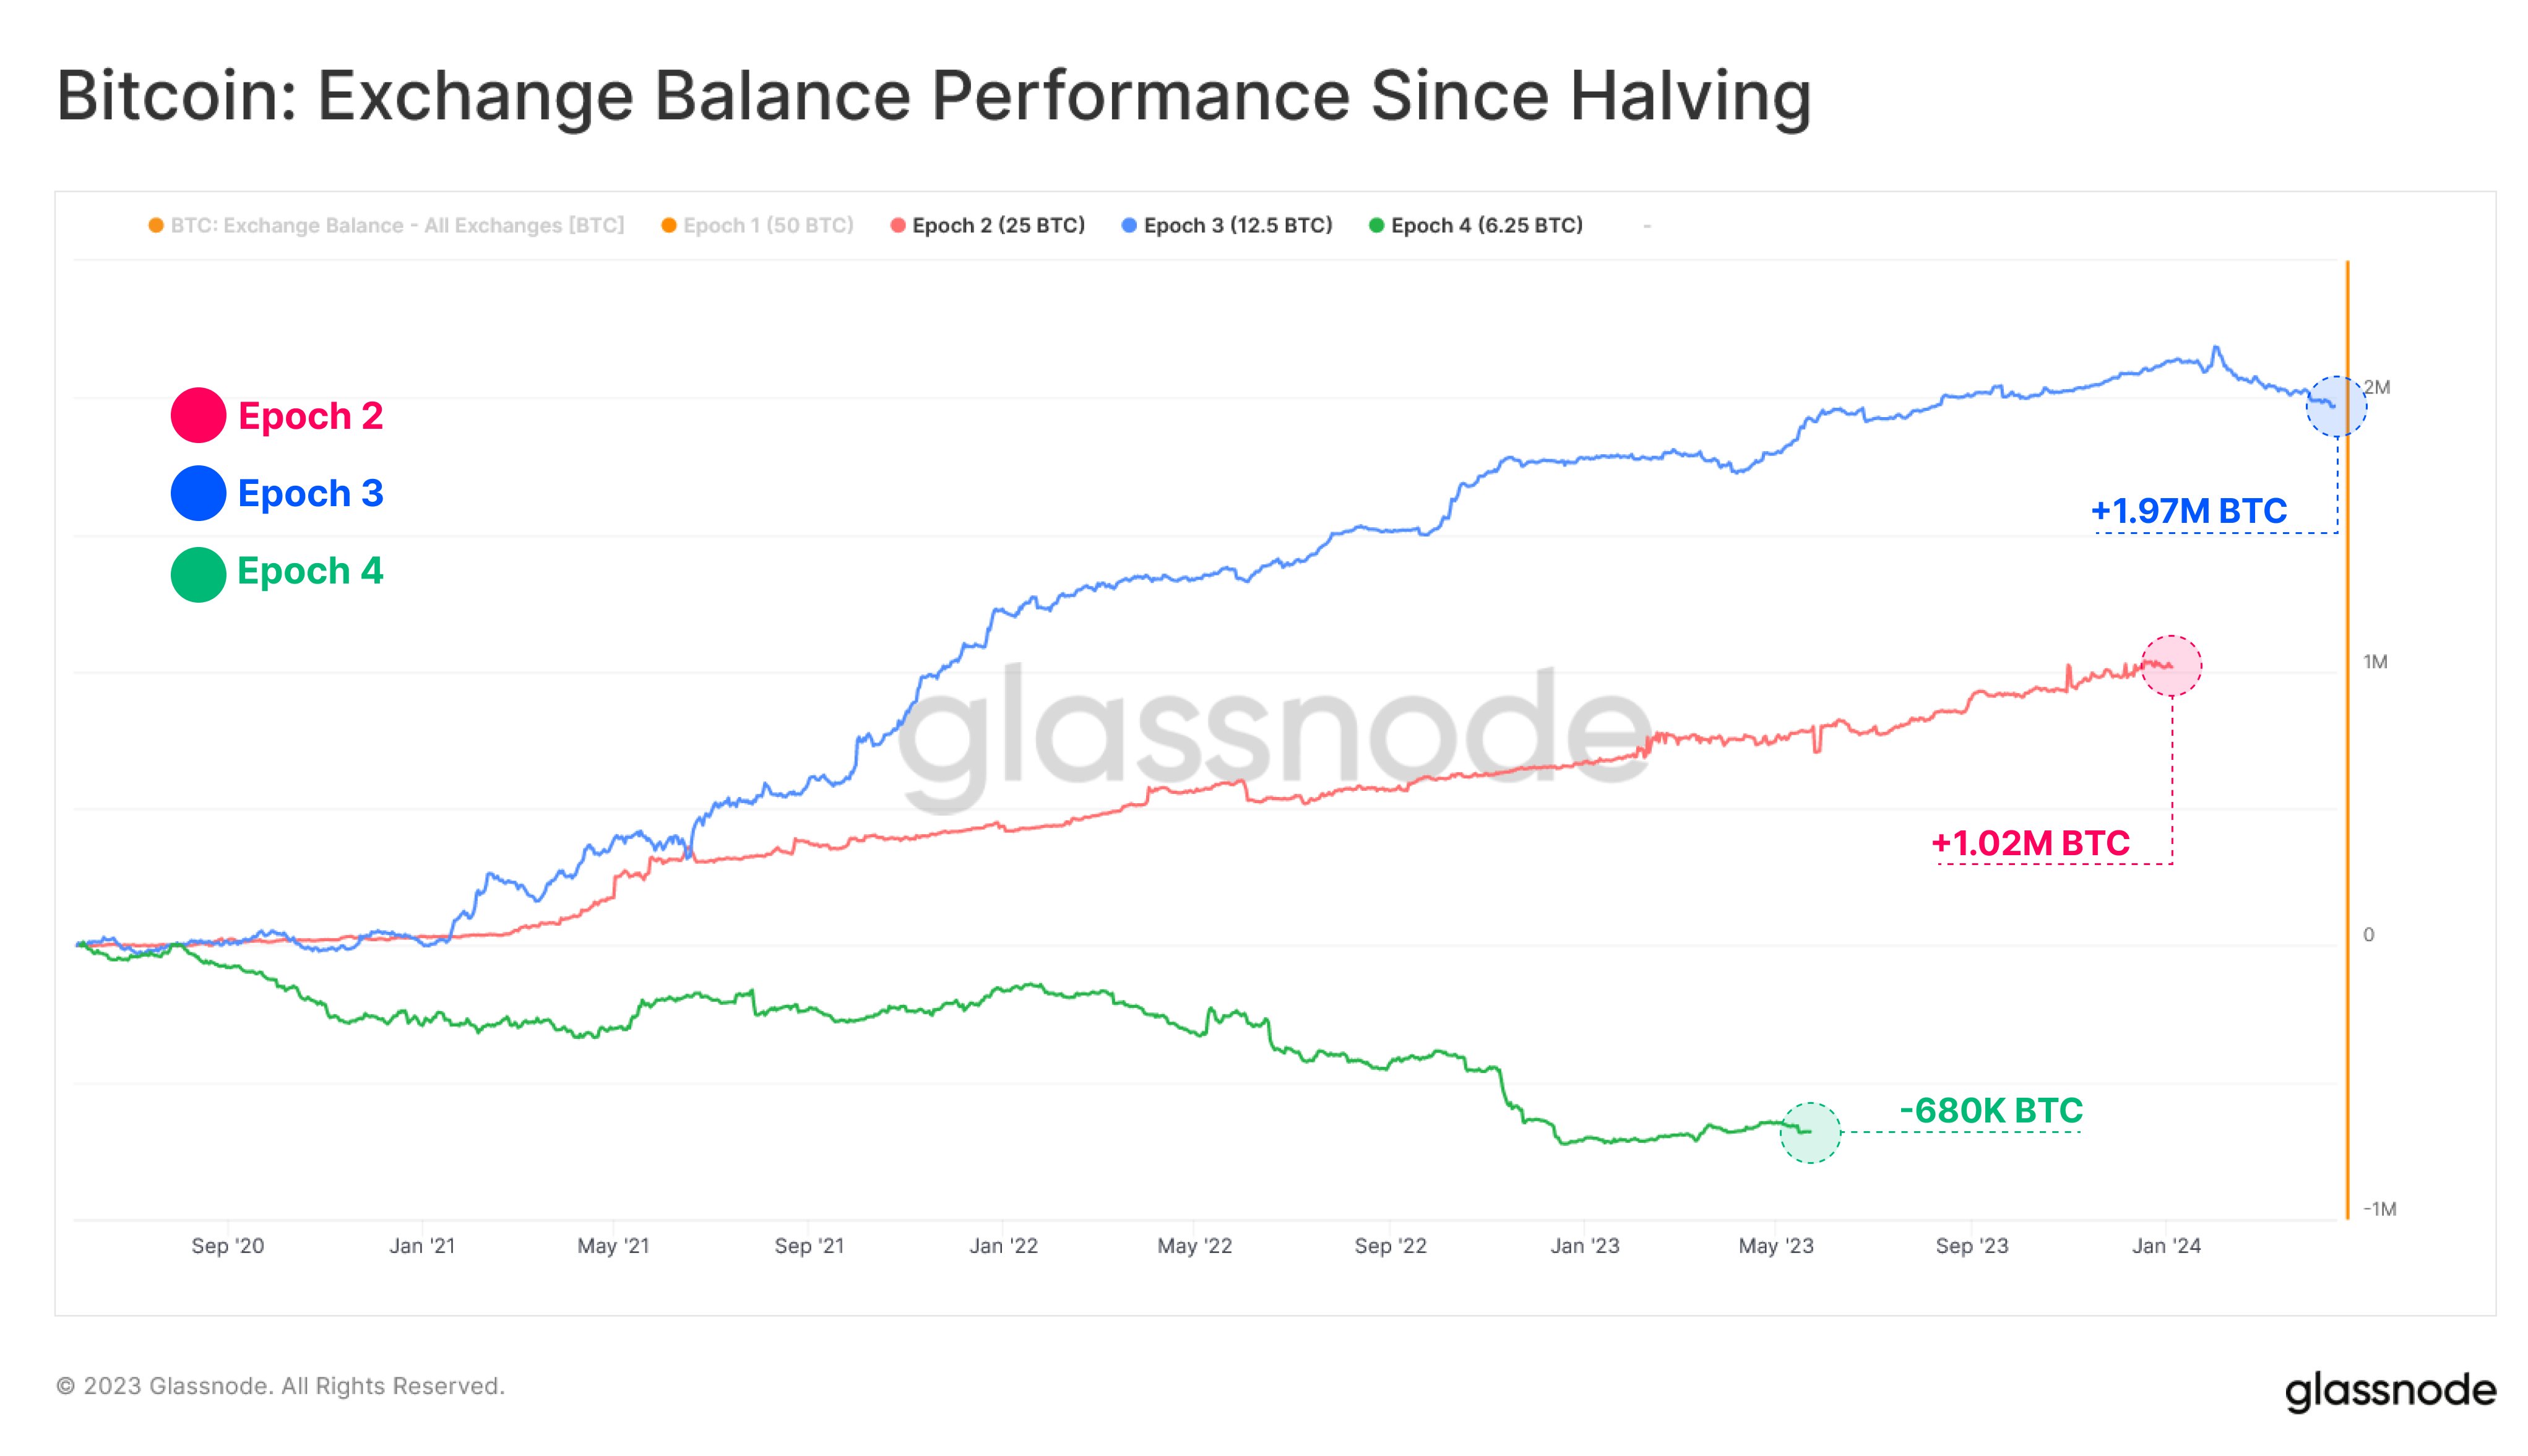
Here is a chart that shows how the value of this Bitcoin indicator has changed during the last two cycles and in the current epoch so far:
Looks like the current cycle is showing a different trend than what was seen before | Source: Glassnode on Twitter
Glassnode has taken the “halvings” as the starting point of each of the cycles or epochs here. Halvings are periodic events where the block rewards of the miners (which they receive for solving blocks on the network) are permanently cut in half. These take place approximately every four years.
These events have wide-reaching consequences for the economics of the cryptocurrency, as the production rate of the asset is constrained following them. This narrative behind the halvings is also so strong that the height of the bull runs has always occurred after them.
From the above graph, it’s visible that during epoch 2, that is, the second cycle that the asset observed, the Bitcoin balance on exchanges saw a net growth of 1.02 million BTC. The next cycle, epoch 3, saw the metric rising by 1.97 million BTC, which is almost double what the previous cycle registered.
Note that epoch 1 is absent here because it was the first time ever that the asset was trading, and hence, BTC exchanges were also only a new existence. This means that their supply could have only gone up here, as it previously didn’t exist at all.
Unlike these cycles, however, where the exchanges received a large number of net inflows, the current epoch has seen investors taking out around 680,000 BTC from these platforms.
The below chart highlights how this decline in the Bitcoin balance on exchanges has taken place.
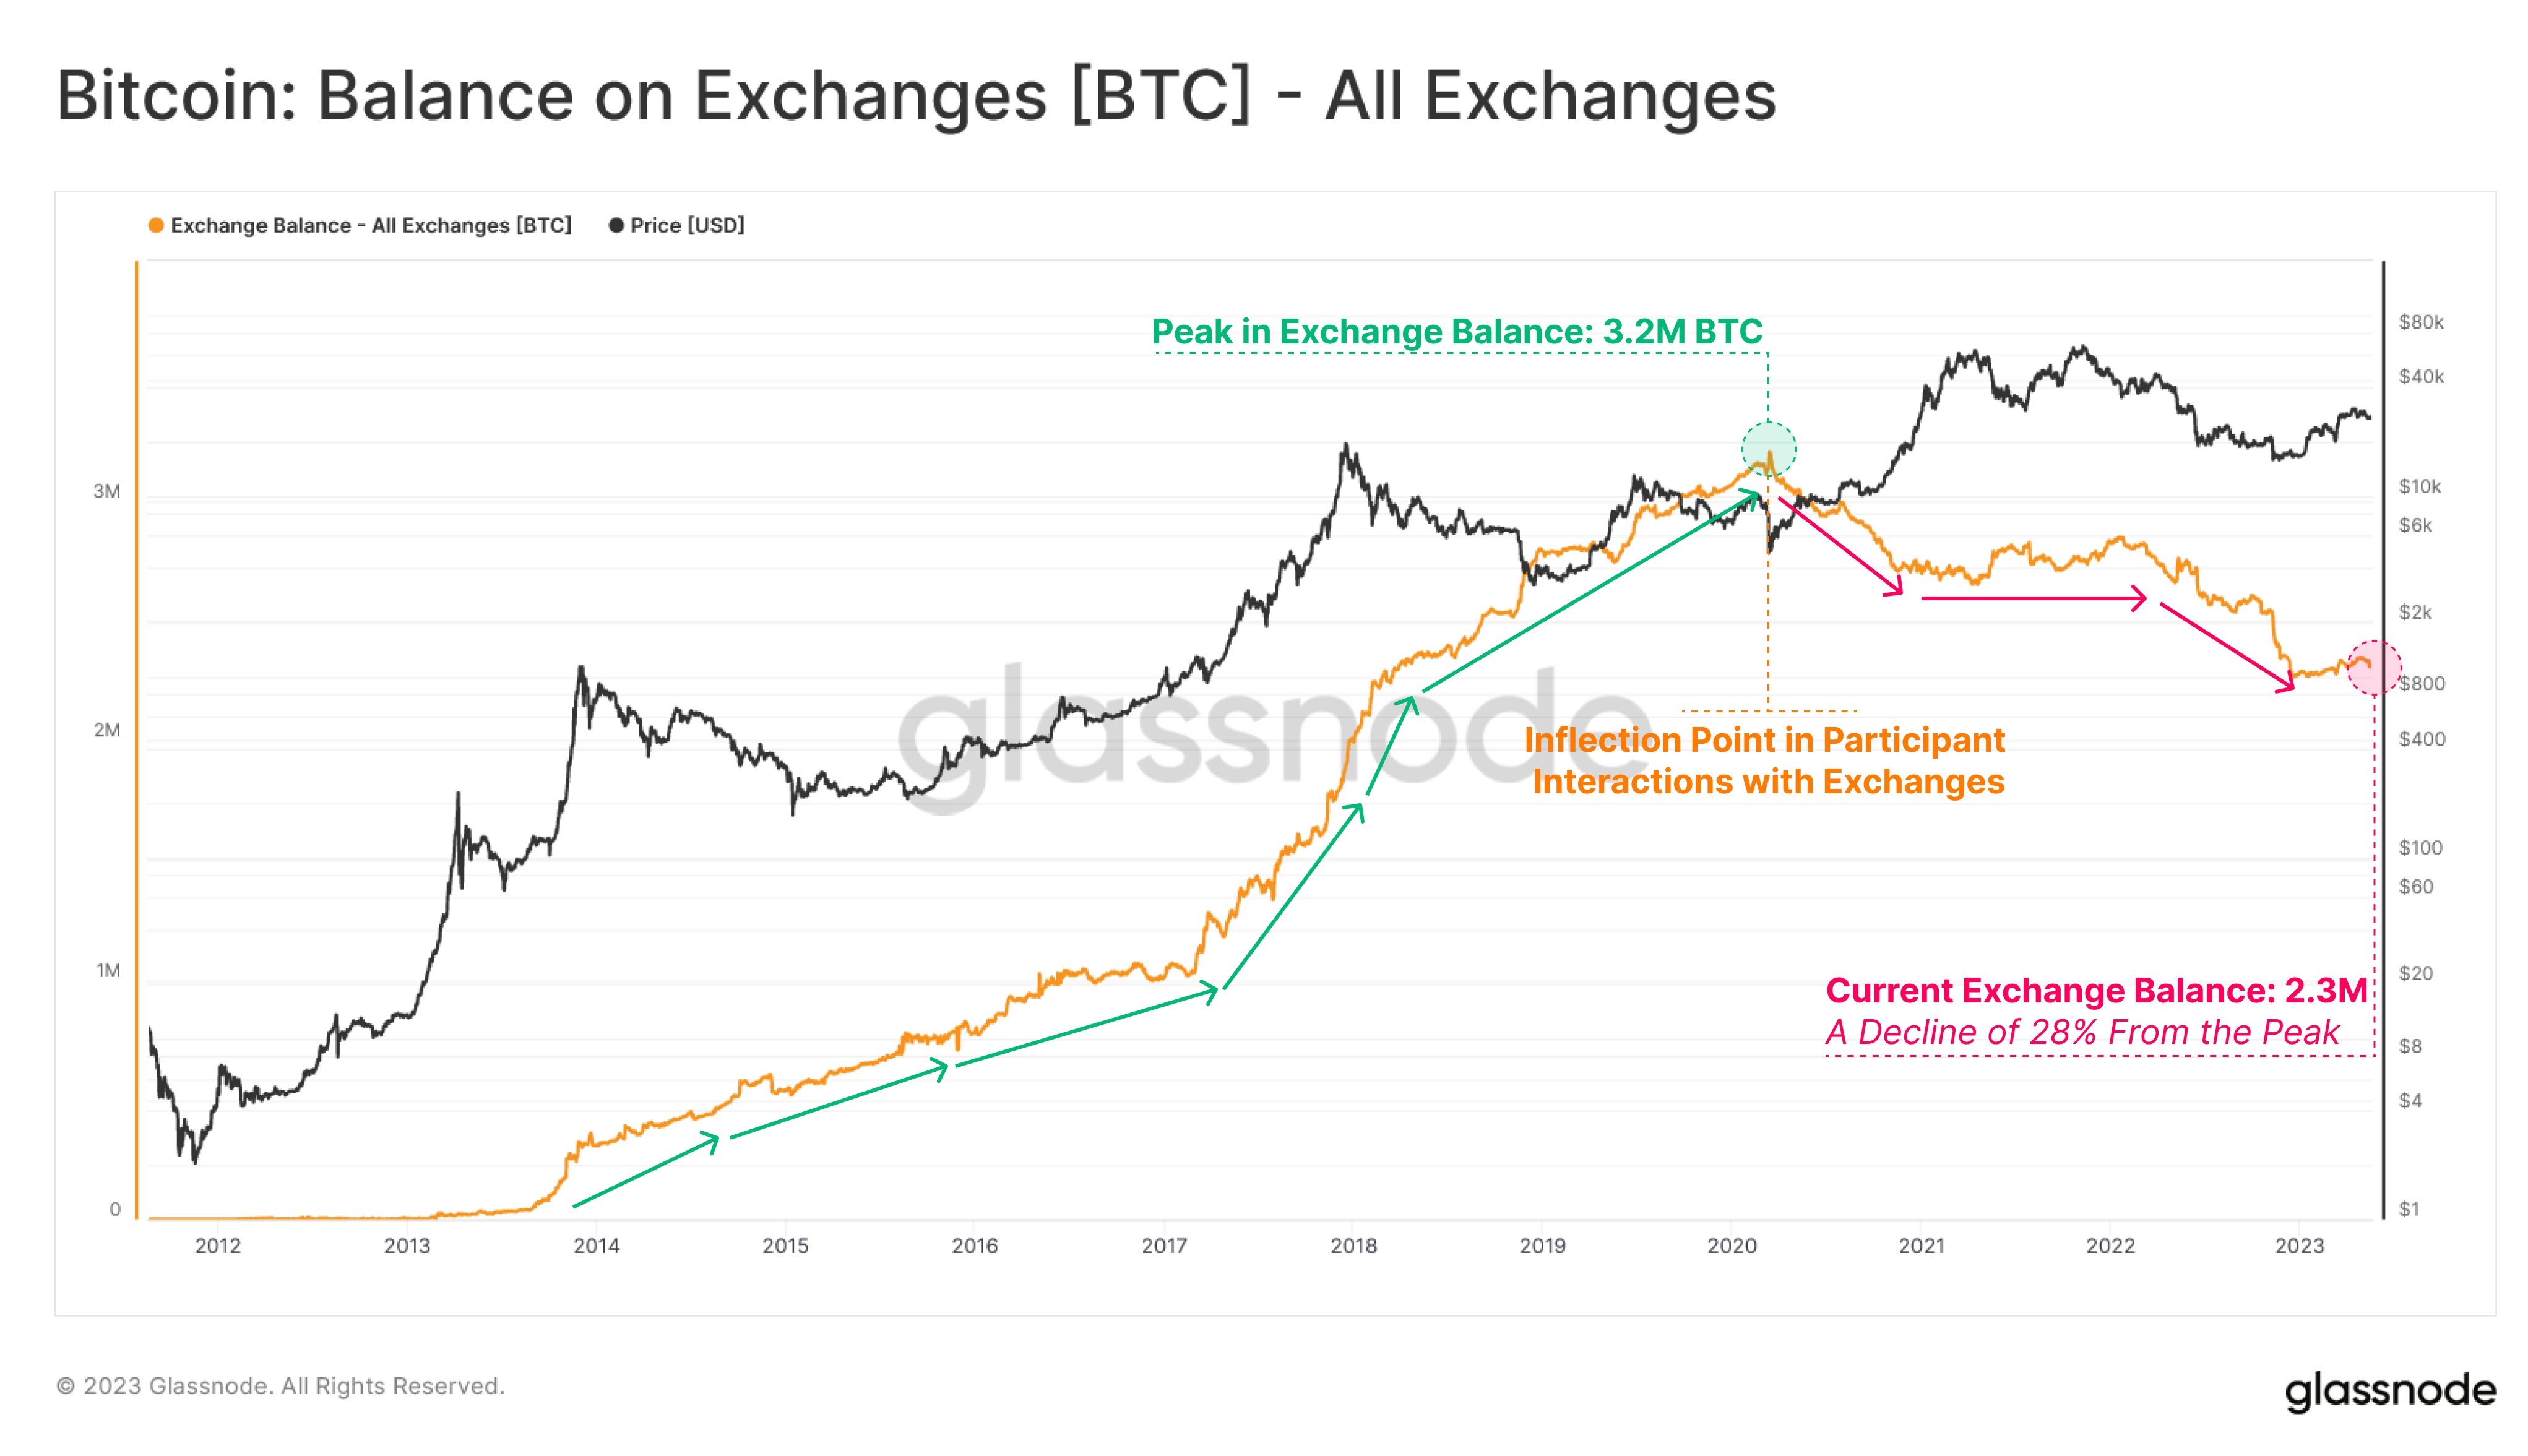
The value of the metric seems to have been going down in recent months | Source: Glassnode on Twitter
As displayed in the above graph, the Bitcoin balance on exchanges hit a peak value of 3.2 million BTC just before the COVID crash took place back in March 2020.
“Retrospectively, the Covid Crisis appeared to be a catalyst for an inflection in participant interaction with exchanges, marking the inauguration of a macro decline in Exchange Balances,” notes Glassnode.
Today, the indicator’s value stands at 2.3 million BTC, which suggests a decline of 28% from the peak. This cycle is out of the ordinary in terms of this metric, but it’s worth keeping in mind that the epoch is yet to end.
However, it’s nonetheless unlikely that a reversal could take place now to keep the current cycle in line with the pattern from the previous cycles, as the next halving isn’t that far anymore (2024).
BTC Price
At the time of writing, Bitcoin is trading around $26,700, up 1% in the last week.
BTC has plunged in the past day | Source: BTCUSD on TradingView
Featured image from iStock.com, charts from TradingView.com, Glassnode.com