BTC/USD Elevated Volatility Below 30000: Sally Ho’s Technical Analysis – 3 August 2023
Bitcoin (BTC/USD) continued to experience elevated volatility early in the Asian session as the pair was lifted from the 28552.42 level and reached the 30033 area before moving back below the 29400 area. Stops were recently elected below the 29089.49 and 28775.19 levels, downside price objectives associated with selling pressure around the 29851.28 area. Additional Stops were elected below the 28999, 28874, and 28672 areas during the acute selloff, downside price objectives related to recent selling pressure around the 29526 and 29344 levels. Additional downside price objectives linked to recent selling pressure include the 28432, 27979, 27409, 27246, and 26501 levels. Below the market, additional downside price objectives include the 28213, 28137, 27757, 27430, 27338, 27312, 26348, and 26199 levels. Also, the 28095.44 area represents the 23.6% retracement of the historic depreciating range from 69000 to 15460.
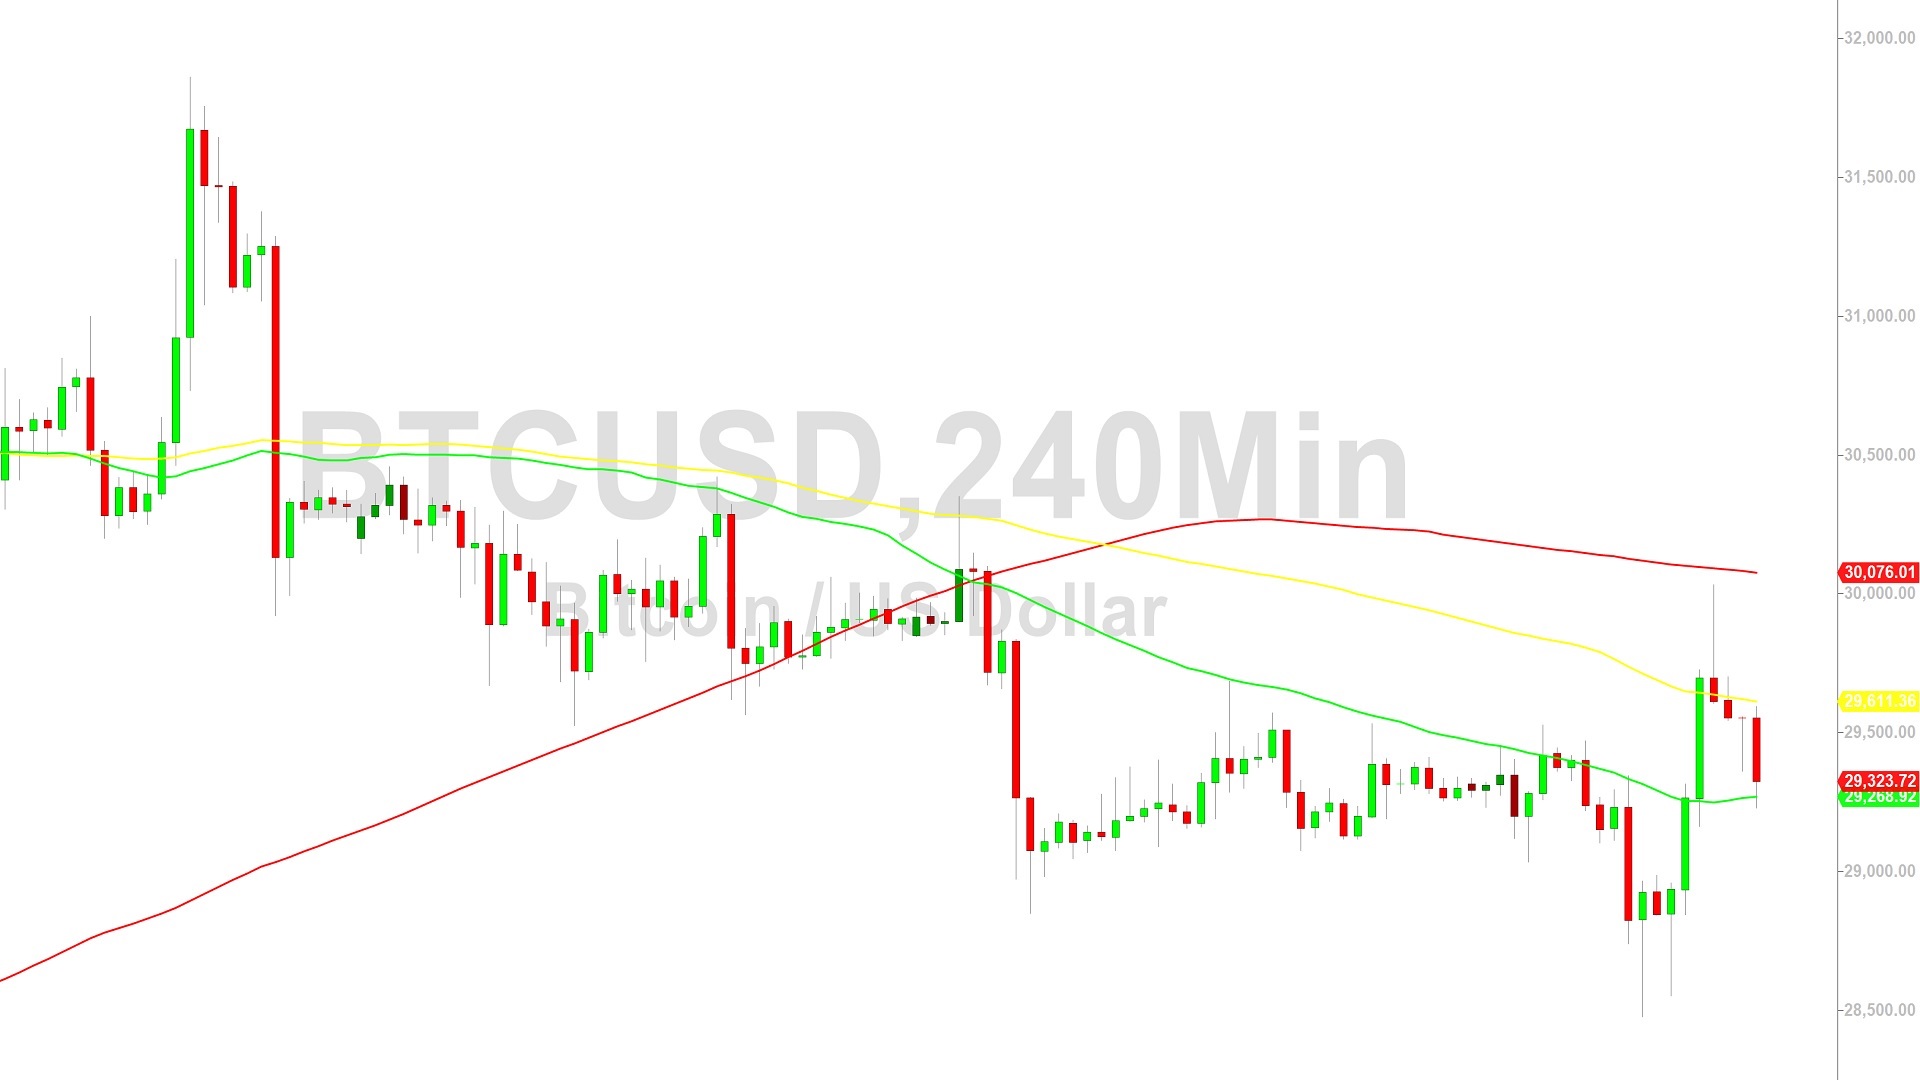
Following recent upside activity, areas of technical support and potential buying pressure include the 28306, 27466, 26428, and 26272 levels. Traders are monitoring the recent depreciating range from 31862.21 to 28850 with upside retracement levels around the 30356, 30711, 31151, and 31217 areas. Above the market, upside price objectives include the 30526, 30611, 30762, and 31145 areas. Upside price objectives related to other levels of buying pressure include the 32125 and 33569 areas, and Stops are cited above additional upside price objectives around the 32043, 34531, 34658, and 35912 areas. Traders are observing that the 50-bar MA (4-hourly) is bearishly indicating below the 100-bar MA (4-hourly) and below the 200-bar MA (4-hourly). Also, the 50-bar MA (hourly) is bearishly indicating below the 100-bar MA (hourly) and below the 200-bar MA (hourly).
Price activity is nearest the 100-bar MA (4-hourly) at 29611.97 and the 100-bar MA (Hourly) at 29286.97.
Technical Support is expected around 24440.41/ 23270.10/ 22769.39 with Stops expected below.
Technical Resistance is expected around 31986.16/ 32989.19/ 34658.69 with Stops expected above.
On 4-Hourly chart, SlowK is Bearishly below SlowD while MACD is Bullishly above MACDAverage.
On 60-minute chart, SlowK is Bearishly below SlowD while MACD is Bearishly below MACDAverage.
Disclaimer: Sally Ho’s Technical Analysis is provided by a third party, and for informational purposes only. It does not reflect the views of Crypto Daily, nor is it intended to be used as legal, tax, investment, or financial advice.