Bitcoin Short-Term Holders Realizing Profits 55x The Losses
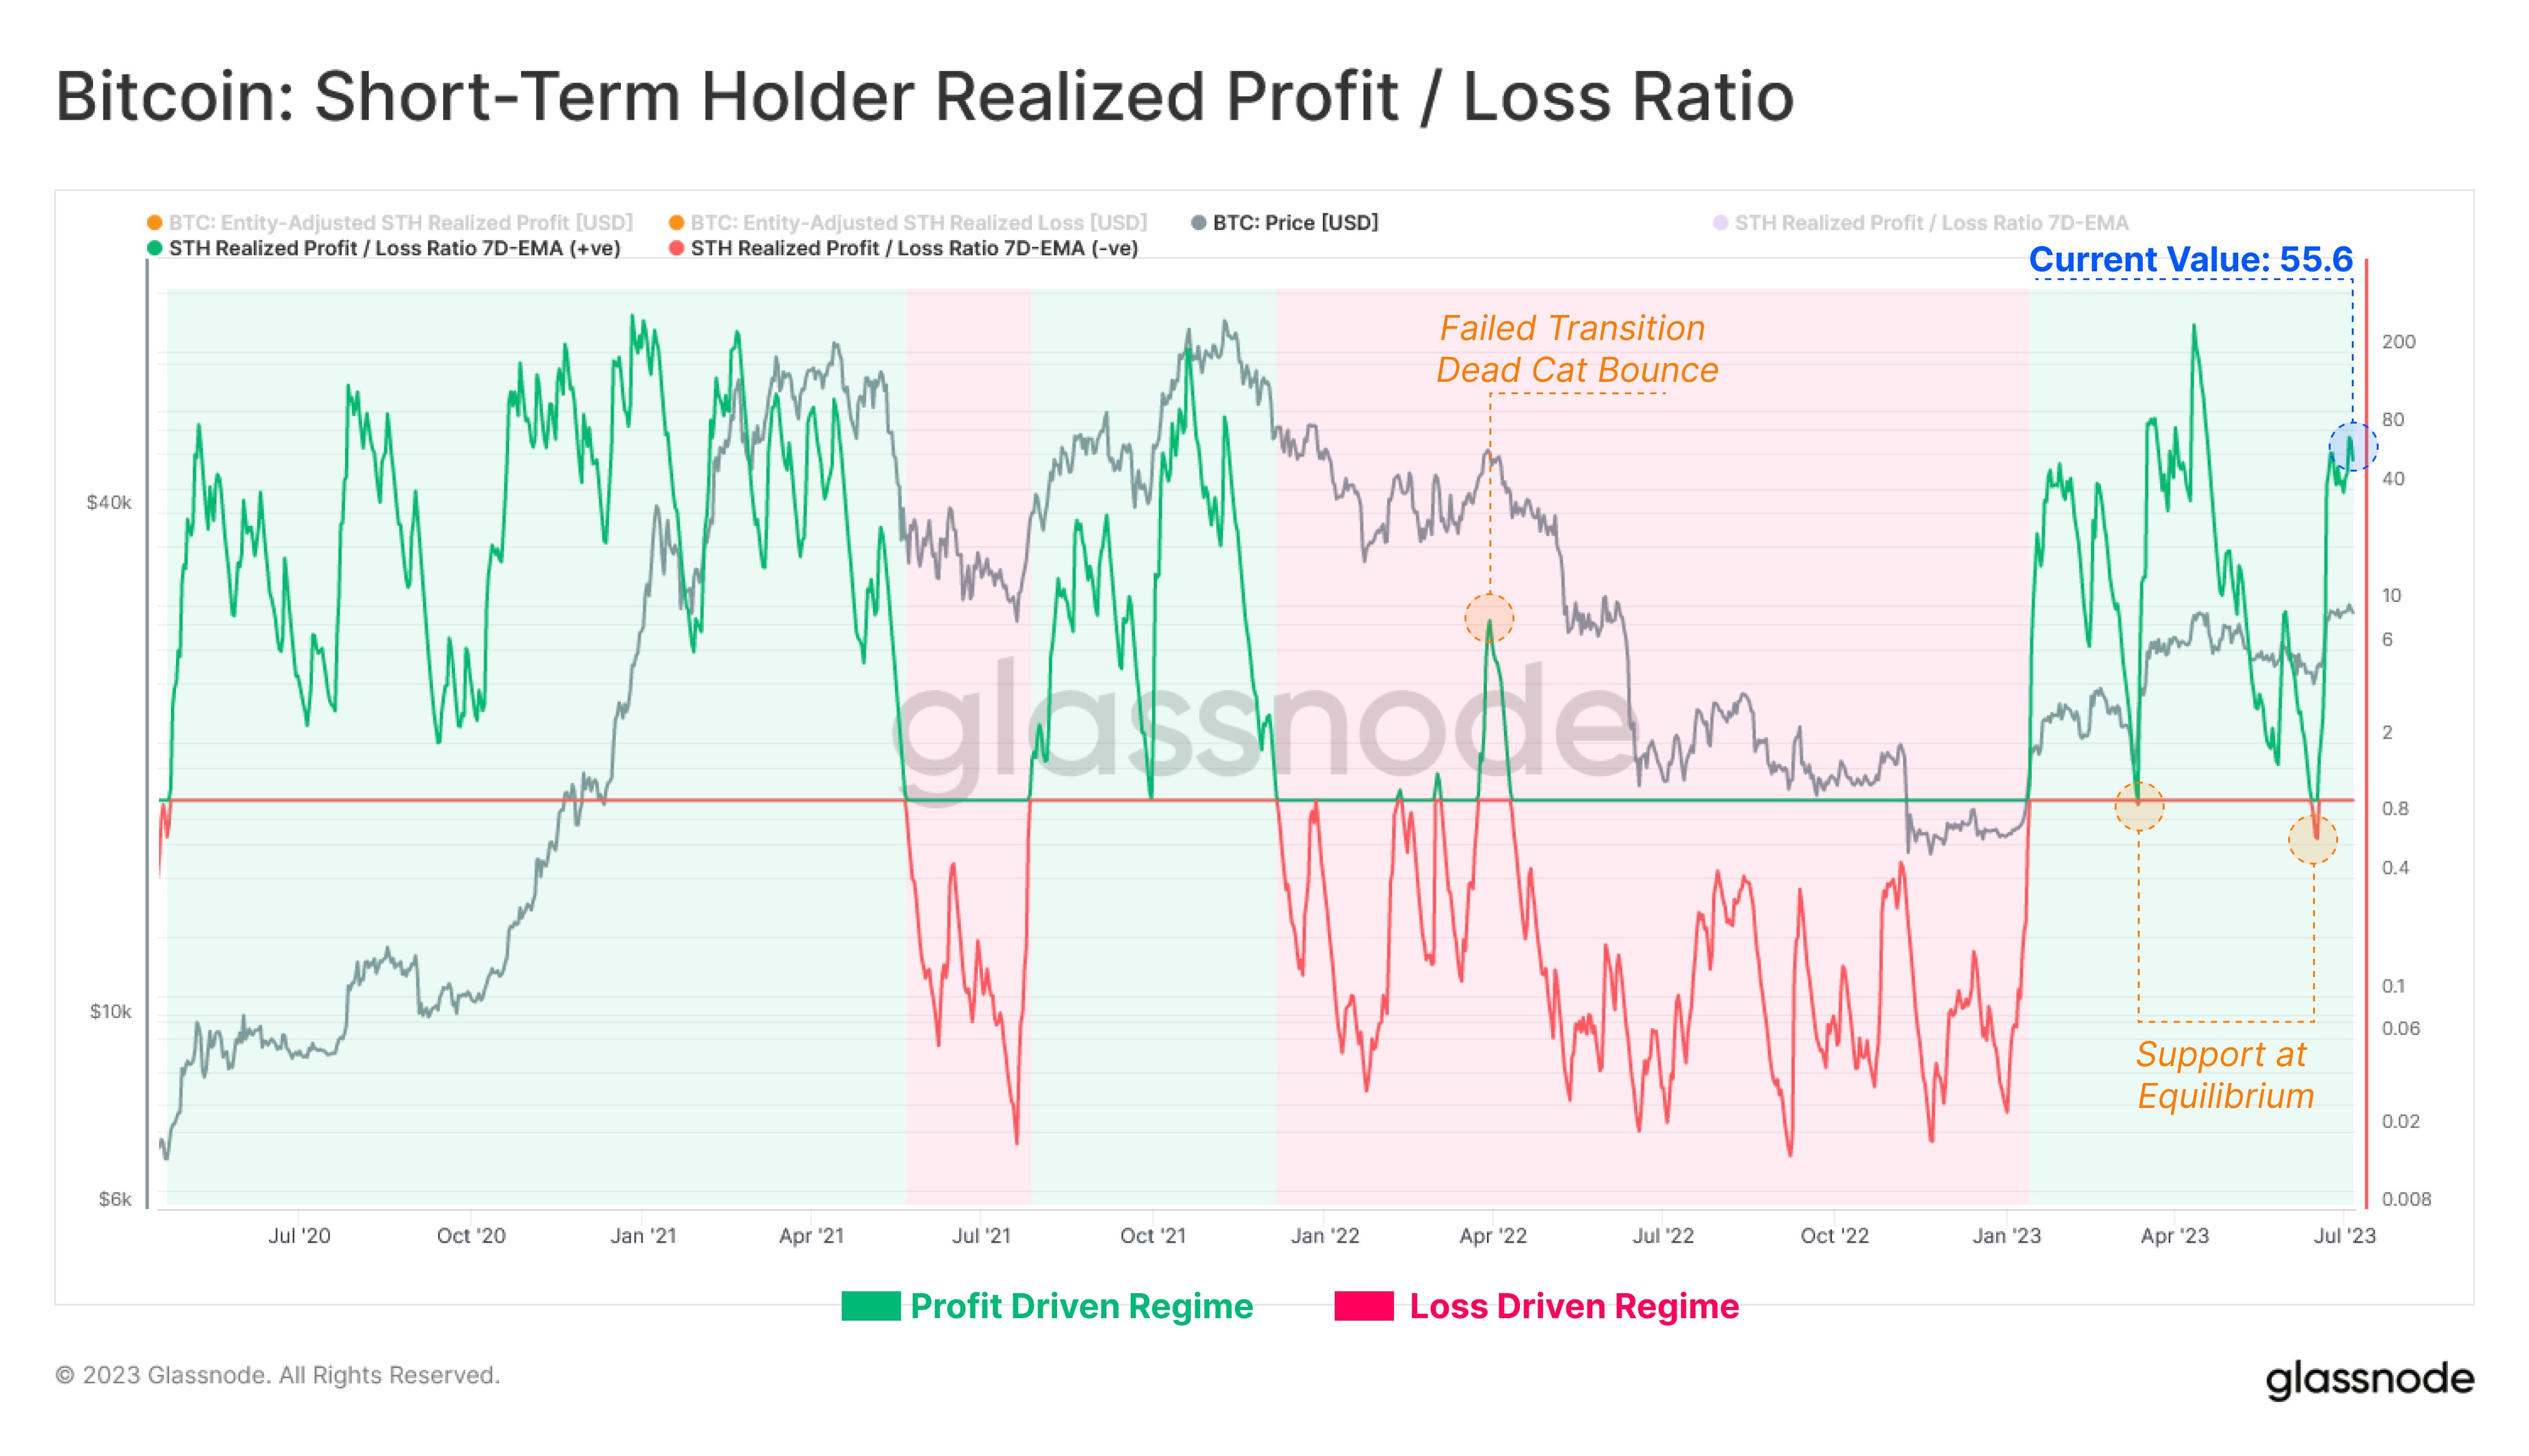
On-chain data from Glassnode shows that Bitcoin short-term holders are currently realizing 55.6 times as many profits as losses.
Bitcoin Short-Term Holders Continue To Take Profits
According to data from the on-chain analytics firm Glassnode, the short-term holders have been participating in a large amount of profit-taking recently. The relevant indicator here is the “realized profit/loss ratio,” which measures the ratio between the amount of profits and losses that Bitcoin investors as a whole are harvesting through their selling right now.
This indicator works by going through the on-chain history of each coin being sold to see what price it was last moved at. If this previous price for any coin was less than the current spot price, then that coin is being sold at a profit now.
On the other hand, in the opposite case, the coin’s sale is realizing a loss. The metric adds up such profits and losses that investors are taking throughout the network and calculates their ratio.
This indicator is for the entire market, but it can also be defined for only specific segments of it. In the context of the current discussion, the “short-term holder” (STH) cohort is of interest. The STHs include all investors who have been holding onto their coins since less than 155 days ago.
Now, here is a chart that shows the trend in the 7-day exponential moving average (EMA) Bitcoin STH realized profit/loss ratio over the last few years:
The 7-day EMA value of the metric seems to have been quite high in recent days | Source: Glassnode on Twitter
As displayed in the above graph, the 7-day EMA Bitcoin STH realized profit/loss ratio has been above a value of 1 recently. This means that the profit being realized by this cohort has been greater than the loss.
Historically, the indicator has usually been inside this territory during rallies, as the STHs naturally get into large profits in such periods, and being the short-term focused investors that they are, they tend to easily sell, thus leading to a spike in profit-taking.
Similarly, during bearish periods where the price is generally in a constant decline, this indicator has stayed below the 1 mark, as most of the selling from these investors takes place at a loss.
Interestingly, the 1 level, which separates the loss-taking and the profit-taking regimes, has had some special interactions with the price of the cryptocurrency. During bullish periods, this level has provided support to the asset, while it has acted as resistance in bear markets.
In the graph, Glassnode has marked the latest two such retests of the level. Both these retests took place during the last few months and both of them occurred at points where the Bitcoin rally appeared to be dying out. However, these retests turned out to be successful and a rebound took place at the touch of the level.
The STHs are now once again firmly in a profit-driven regime, as the ratio’s value has spiked inside the profit territory. At the current values of the indicator, the STHs are harvesting 55.6 times more profits than losses.
BTC Price
At the time of writing, Bitcoin is trading around $30,500, down 1% in the last week.
BTC has been consolidating sideways recently | Source: BTCUSD on TradingView
Featured image from iStock.com, charts from TradingView.com, Glassnode.com

