Bitcoin Shrimps hit ATH As Aggressive Accumulation Continues
On-chain data shows the Bitcoin shrimp supply has hit all-time high values as these small investors have continued to aggressively accumulate.
Bitcoin Shrimp Supply Has Hit A New All-Time High Value
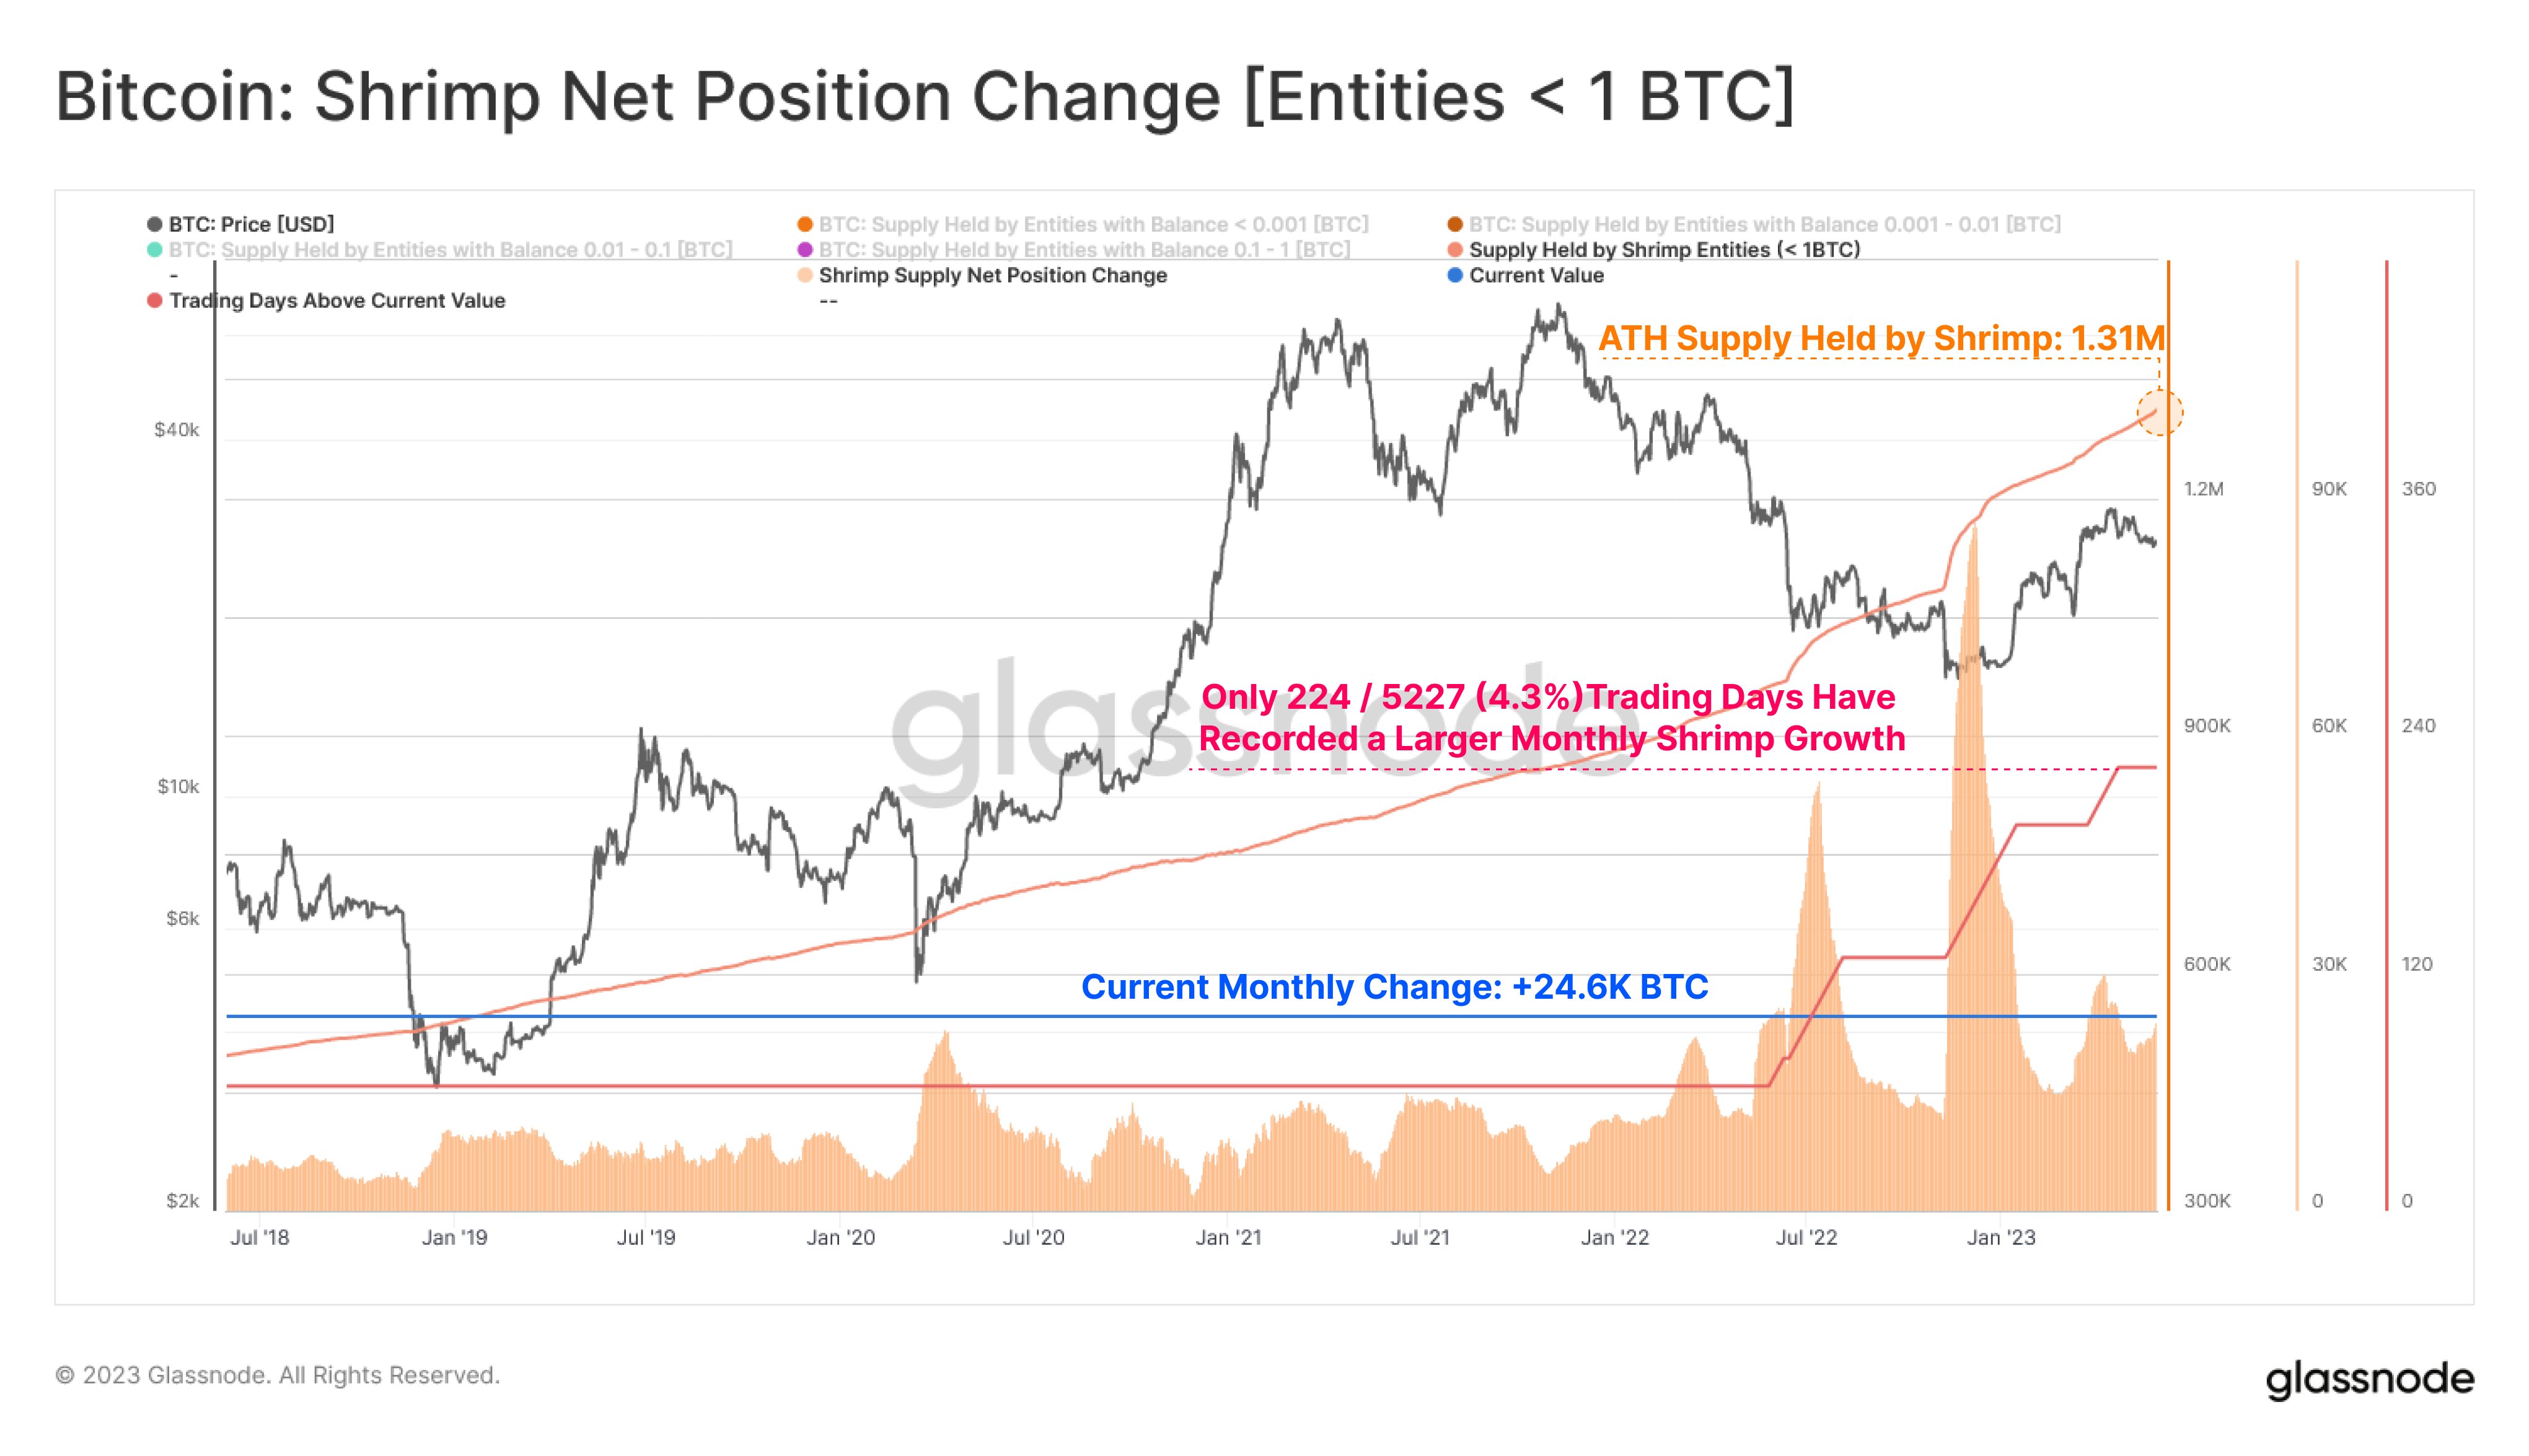
According to data from the on-chain analytics firm Glassnode, the supply held by shrimps has gone up by 24,600 BTC in the past month alone. The “shrimps” here refer to Bitcoin holders that are currently carrying a wallet balance of less than 1 BTC.
As these investors are holding such low amounts, they are likely to be retail investors. This means that the “shrimp supply” (which is naturally the total amount of Bitcoin that the combined addresses of such holders are holding at the moment) can provide insight into the behavior of the retail investors.
When the shrimp supply trends are up, it implies that the shrimps are accumulating right now, while a downtrend of the indicator suggests that these holders may be distributing their holdings currently.
Now, here is a chart that shows the trend in the Bitcoins shrimp supply over the last few years:
The value of the metric has continued to go up in recent weeks | Source: Glassnode on Twitter
As displayed in the above graph, the Bitcoin shrimp supply had been observing a gradual increase until around the middle of the year 2022, but since then, the rise seems to have accelerated.
This suggests that while retail investors have always been growing their supply without stopping, the accumulation has become especially aggressive in the past year or so.
The chart also contains the data for another on-chain indicator, called the “shrimp supply net position change.” As the metric’s name would already suggest, it tracks the net change in the supply of these small investors. More specifically, the change in the past 30 days (that is, the monthly change) is being measured by the indicator here.
When this indicator has a value less than zero, it means that the shrimps have been selling a net amount of their coins during the past month. On the other hand, positive values imply a net growth in their supply.
From the graph, it’s visible that this indicator hasn’t really gone into negative territory in the last few years at all, suggesting that this cohort has only seen positive growth in this period.
There are two events in particular where the Bitcoin shrimp net supply change seems to have seen especially large spikes; the 3AC bankruptcy in June 2022 and the FTX collapse in November 2022.
Both of these events involved centralized platforms going down, which lead to FUD in the market around keeping coins in the custody of such platforms. So, the accelerated growth in the shrimp supply during these events may have come in part due to some larger holders withdrawing from these platforms and keeping their coins in a batch of smaller wallets.
Recently, the monthly change in the indicator again seems to have been high, although not on the level of these spikes. Around 24,600 BTC has entered into the wallets of the shrimps, taking their combined supply to a new all-time high.
In the entire history of the cryptocurrency, there have only been 224 days (4.3% of trading life) that have registered monthly changes higher than this. The recent aggressive accumulation from the retail investors can be a positive sign for the cryptocurrency, as it’s a sign that the adoption of the coin is catching on.
BTC Price
At the time of writing, Bitcoin is trading around $27,900, up 4% in the last week.
BTC has registered an uplift today | Source: BTCUSD on TradingView
Featured image from Kanchanara on Unsplash.com, charts from TradingView.com, Glassnode.com

