BTC Falls Below $60K but Hidden Sign Hints at a Possible Rally (Bitcoin Price Analysis)
Bitcoin’s price has yet to recover following the crash from $68K a couple of weeks ago.
The cryptocurrency has been consolidating in a tight range, leaving market participants wondering about its future direction.
BTC Price Technical Analysis
By TradingRage
The Daily Chart
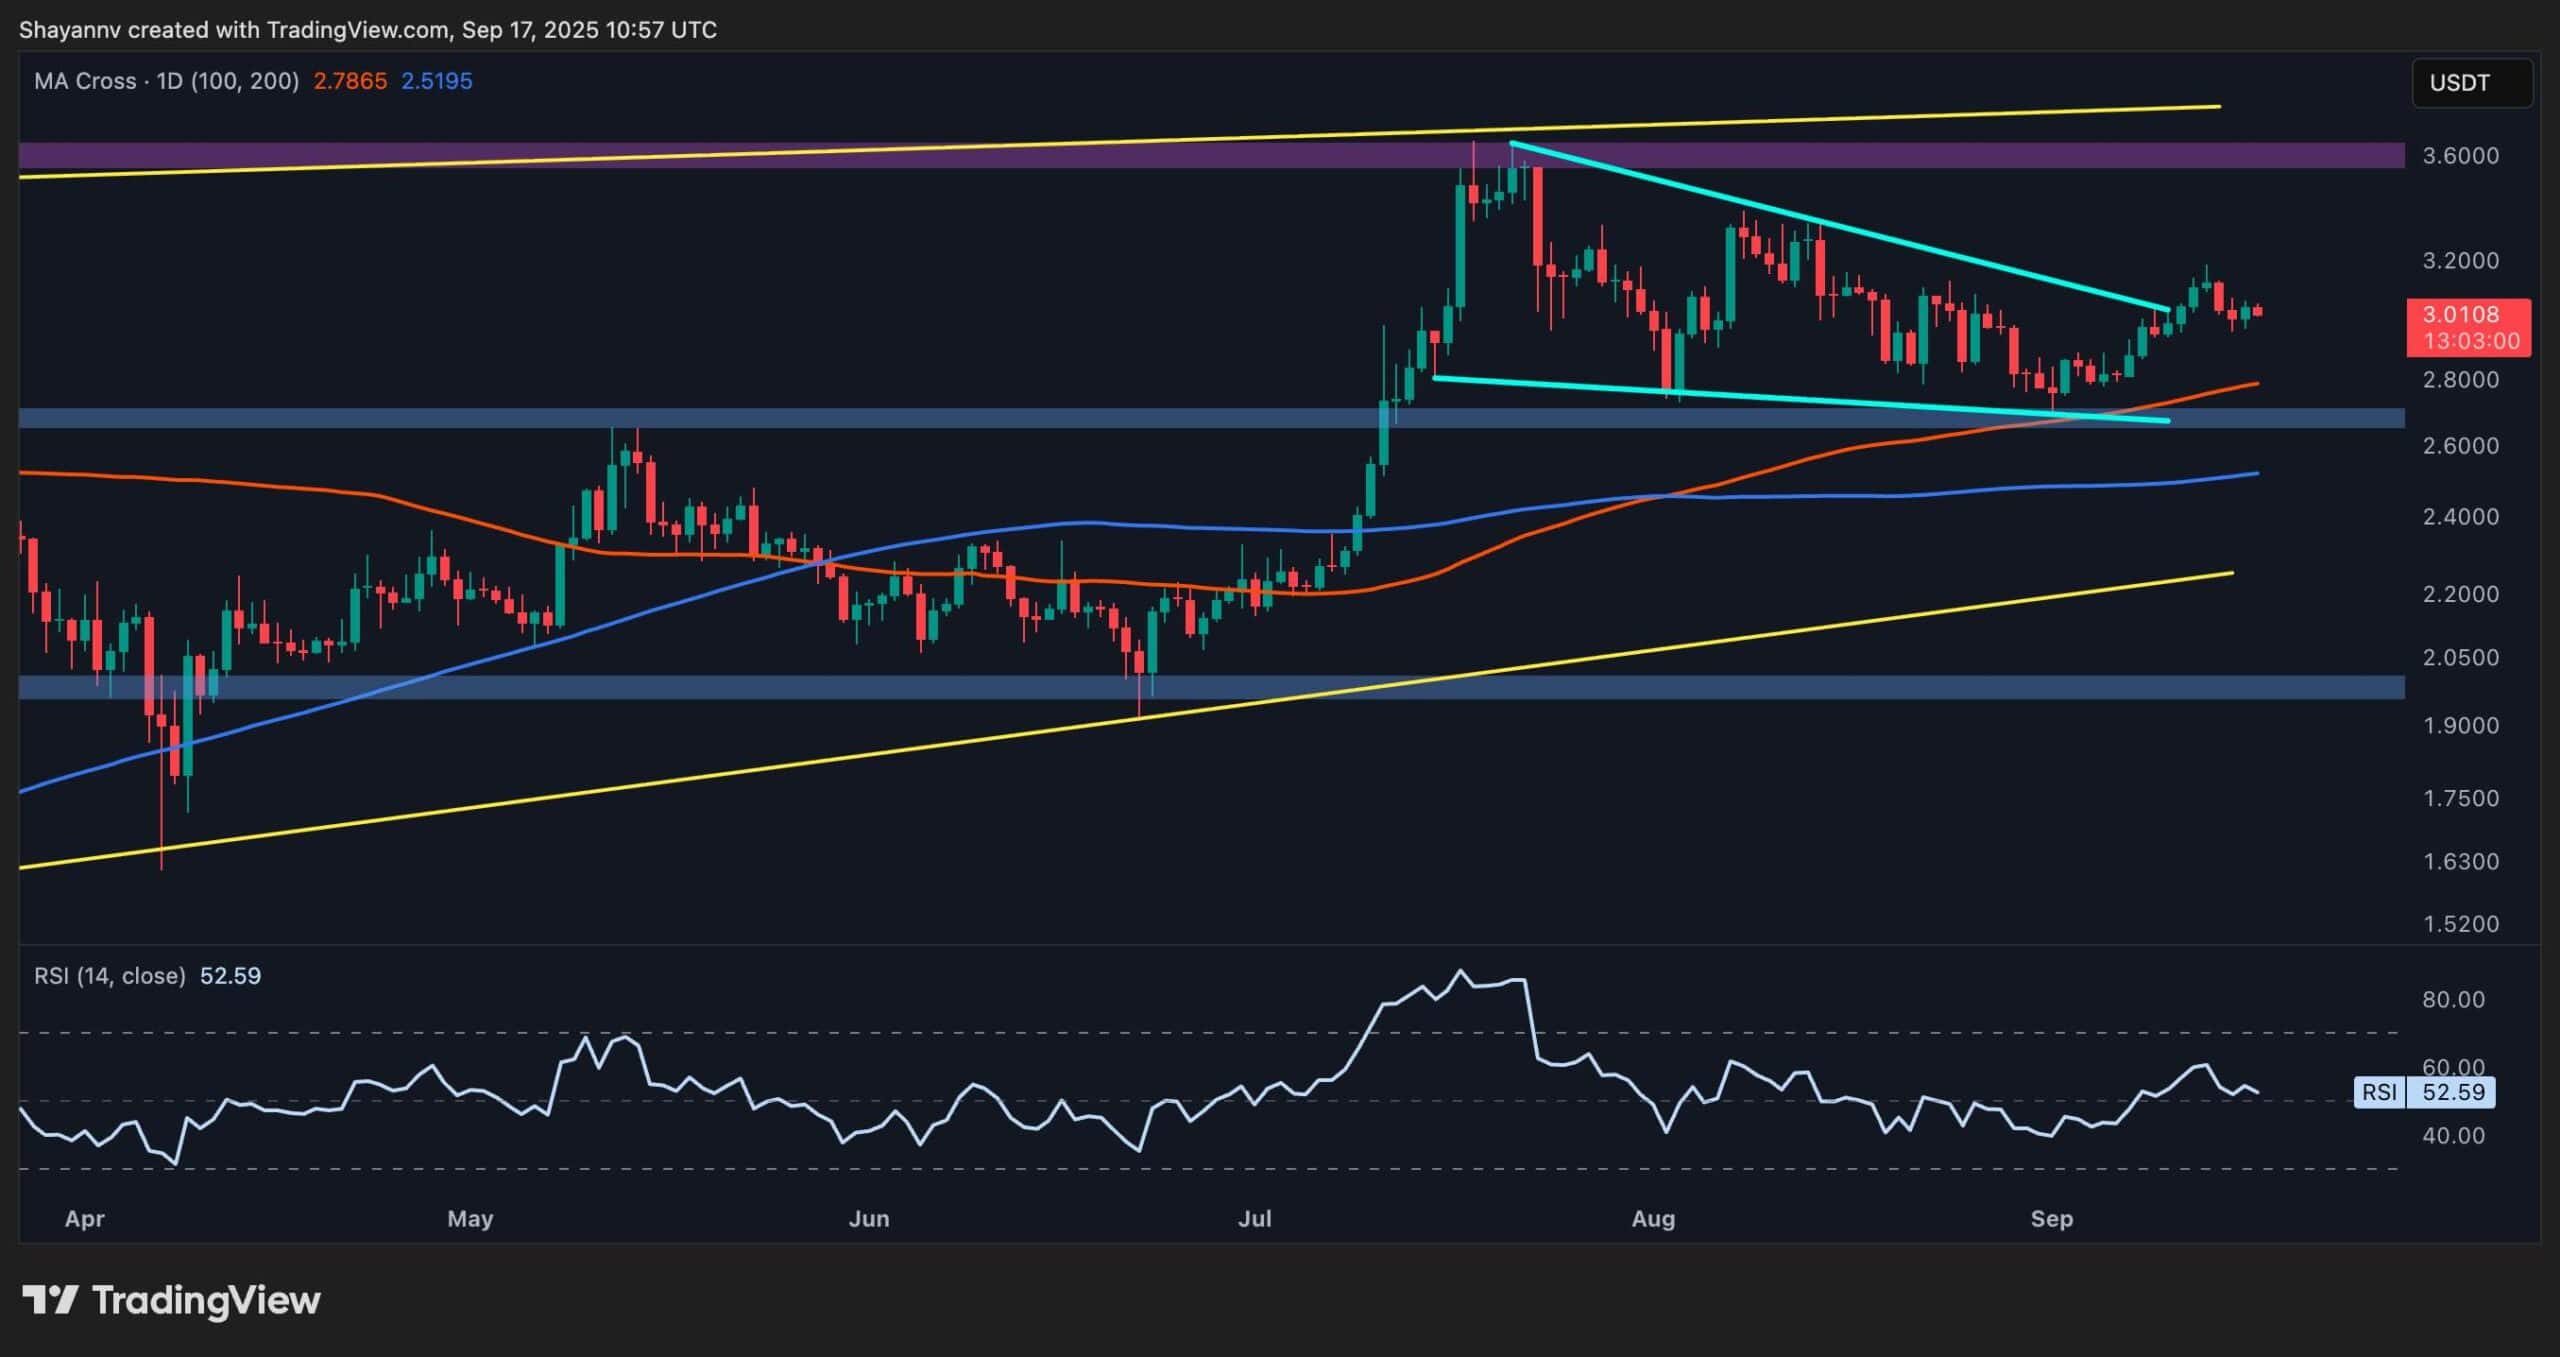
The daily chart shows that the BTC price has failed to climb back above the 200-day moving average, located around the $63K mark, after dropping below it earlier. The market is now consolidating around the $60K level and is yet to reclaim this key area.
Either way, as long as the cryptocurrency is trading below the 200-day moving average, the probability of continuing the long-term bullish trend is considerably low.
The 4-Hour Chart
Looking at the 4-hour timeframe, Bitcoin’s recent rangebound movement becomes clearer. The price has been trapped between the $57K and $60K levels and has yet to break to either side. The RSI also hovers around the 50-point mark, showing indecisiveness in market momentum.
Therefore, to have a more accurate idea of what’s to come, investors should wait for the market to break to the upside or the downside, as the current range does not give away any significant clues.
Bitcoin Price On-Chain Analysis
By TradingRage
Bitcoin Funding Rates
BTC has been going through a lengthy consolidation period, and investors are wondering about its short-term direction. As we already discussed, the charts fail to provide significant hints. However, some optimistic signs can be witnessed in future market metrics.
This chart presents the Bitcoin funding rates metric, which measures whether the buyers or the sellers are executing their orders more aggressively. It is an important indicator in determining futures market sentiment. Positive values indicate bullish sentiment, while negative values support bearish sentiment.
As the chart demonstrates, the funding rates have declined to almost zero, as the recent price drops have led to a significant cool-down in the futures market.
Therefore, a sustainable rally could be on the verge of materializing, as this pattern has been seen before previous price surges. Yet, note that sufficient demand from the spot market must be present for this scenario to occur.
Binance Free $600 (CryptoPotato Exclusive): Use this link to register a new account and receive $600 exclusive welcome offer on Binance (full details).
LIMITED OFFER 2024 at BYDFi Exchange: Up to $2,888 welcome reward, use this link to register and open a 100 USDT-M position for free!
Disclaimer: Information found on CryptoPotato is those of writers quoted. It does not represent the opinions of CryptoPotato on whether to buy, sell, or hold any investments. You are advised to conduct your own research before making any investment decisions. Use provided information at your own risk. See Disclaimer for more information.
Cryptocurrency charts by TradingView.


