Ethereum price eyes breakout, ETHA ETF nears $5b milestone
Ethereum price may be on the verge of a bullish breakout to $4,000 after forming a bullish flag and a golden cross pattern, and as the iShares Ethereum ETF nears a crucial milestone.
Ethereum (ETH) was trading at around $2,500 at last check on Saturday — higher than this week’s low of $2,380.
A potential catalyst for ETH is the ongoing exchange-traded fund inflows, which have surged in the past few weeks. SoSoValue data shows that these funds have added substantial inflows in the past three weeks.
They added $25 million on Friday, the 15th consecutive day of gains, bringing the cumulative inflows to over $3.3 billion. All these funds now hold over $9.4 billion in assets, equivalent to 3.1% of Ethereum’s market cap.
The iShares Ethereum ETF, whose ticker symbol is ETHA, has had a cumulative inflow of $4.85 billion and is slowly nearing the $5 billion milestone. This growth is likely because BlackRock is the biggest name in the ETF industry, and it trades at a 0.35% discount to net asset value.
Rising Ethereum ETF inflows are notable because it is an indirect signal that American institutional investors are buying.
More data shows that Ethereum’s network is doing well. For example, the total value locked in its decentralized finance ecosystem has jumped by 26% in the last 30 days to $130 billion. Its bridged TVL has moved to about $400 billion, while the stablecoins in its network have jumped to $125 billion.
Ethereum price technical analysis

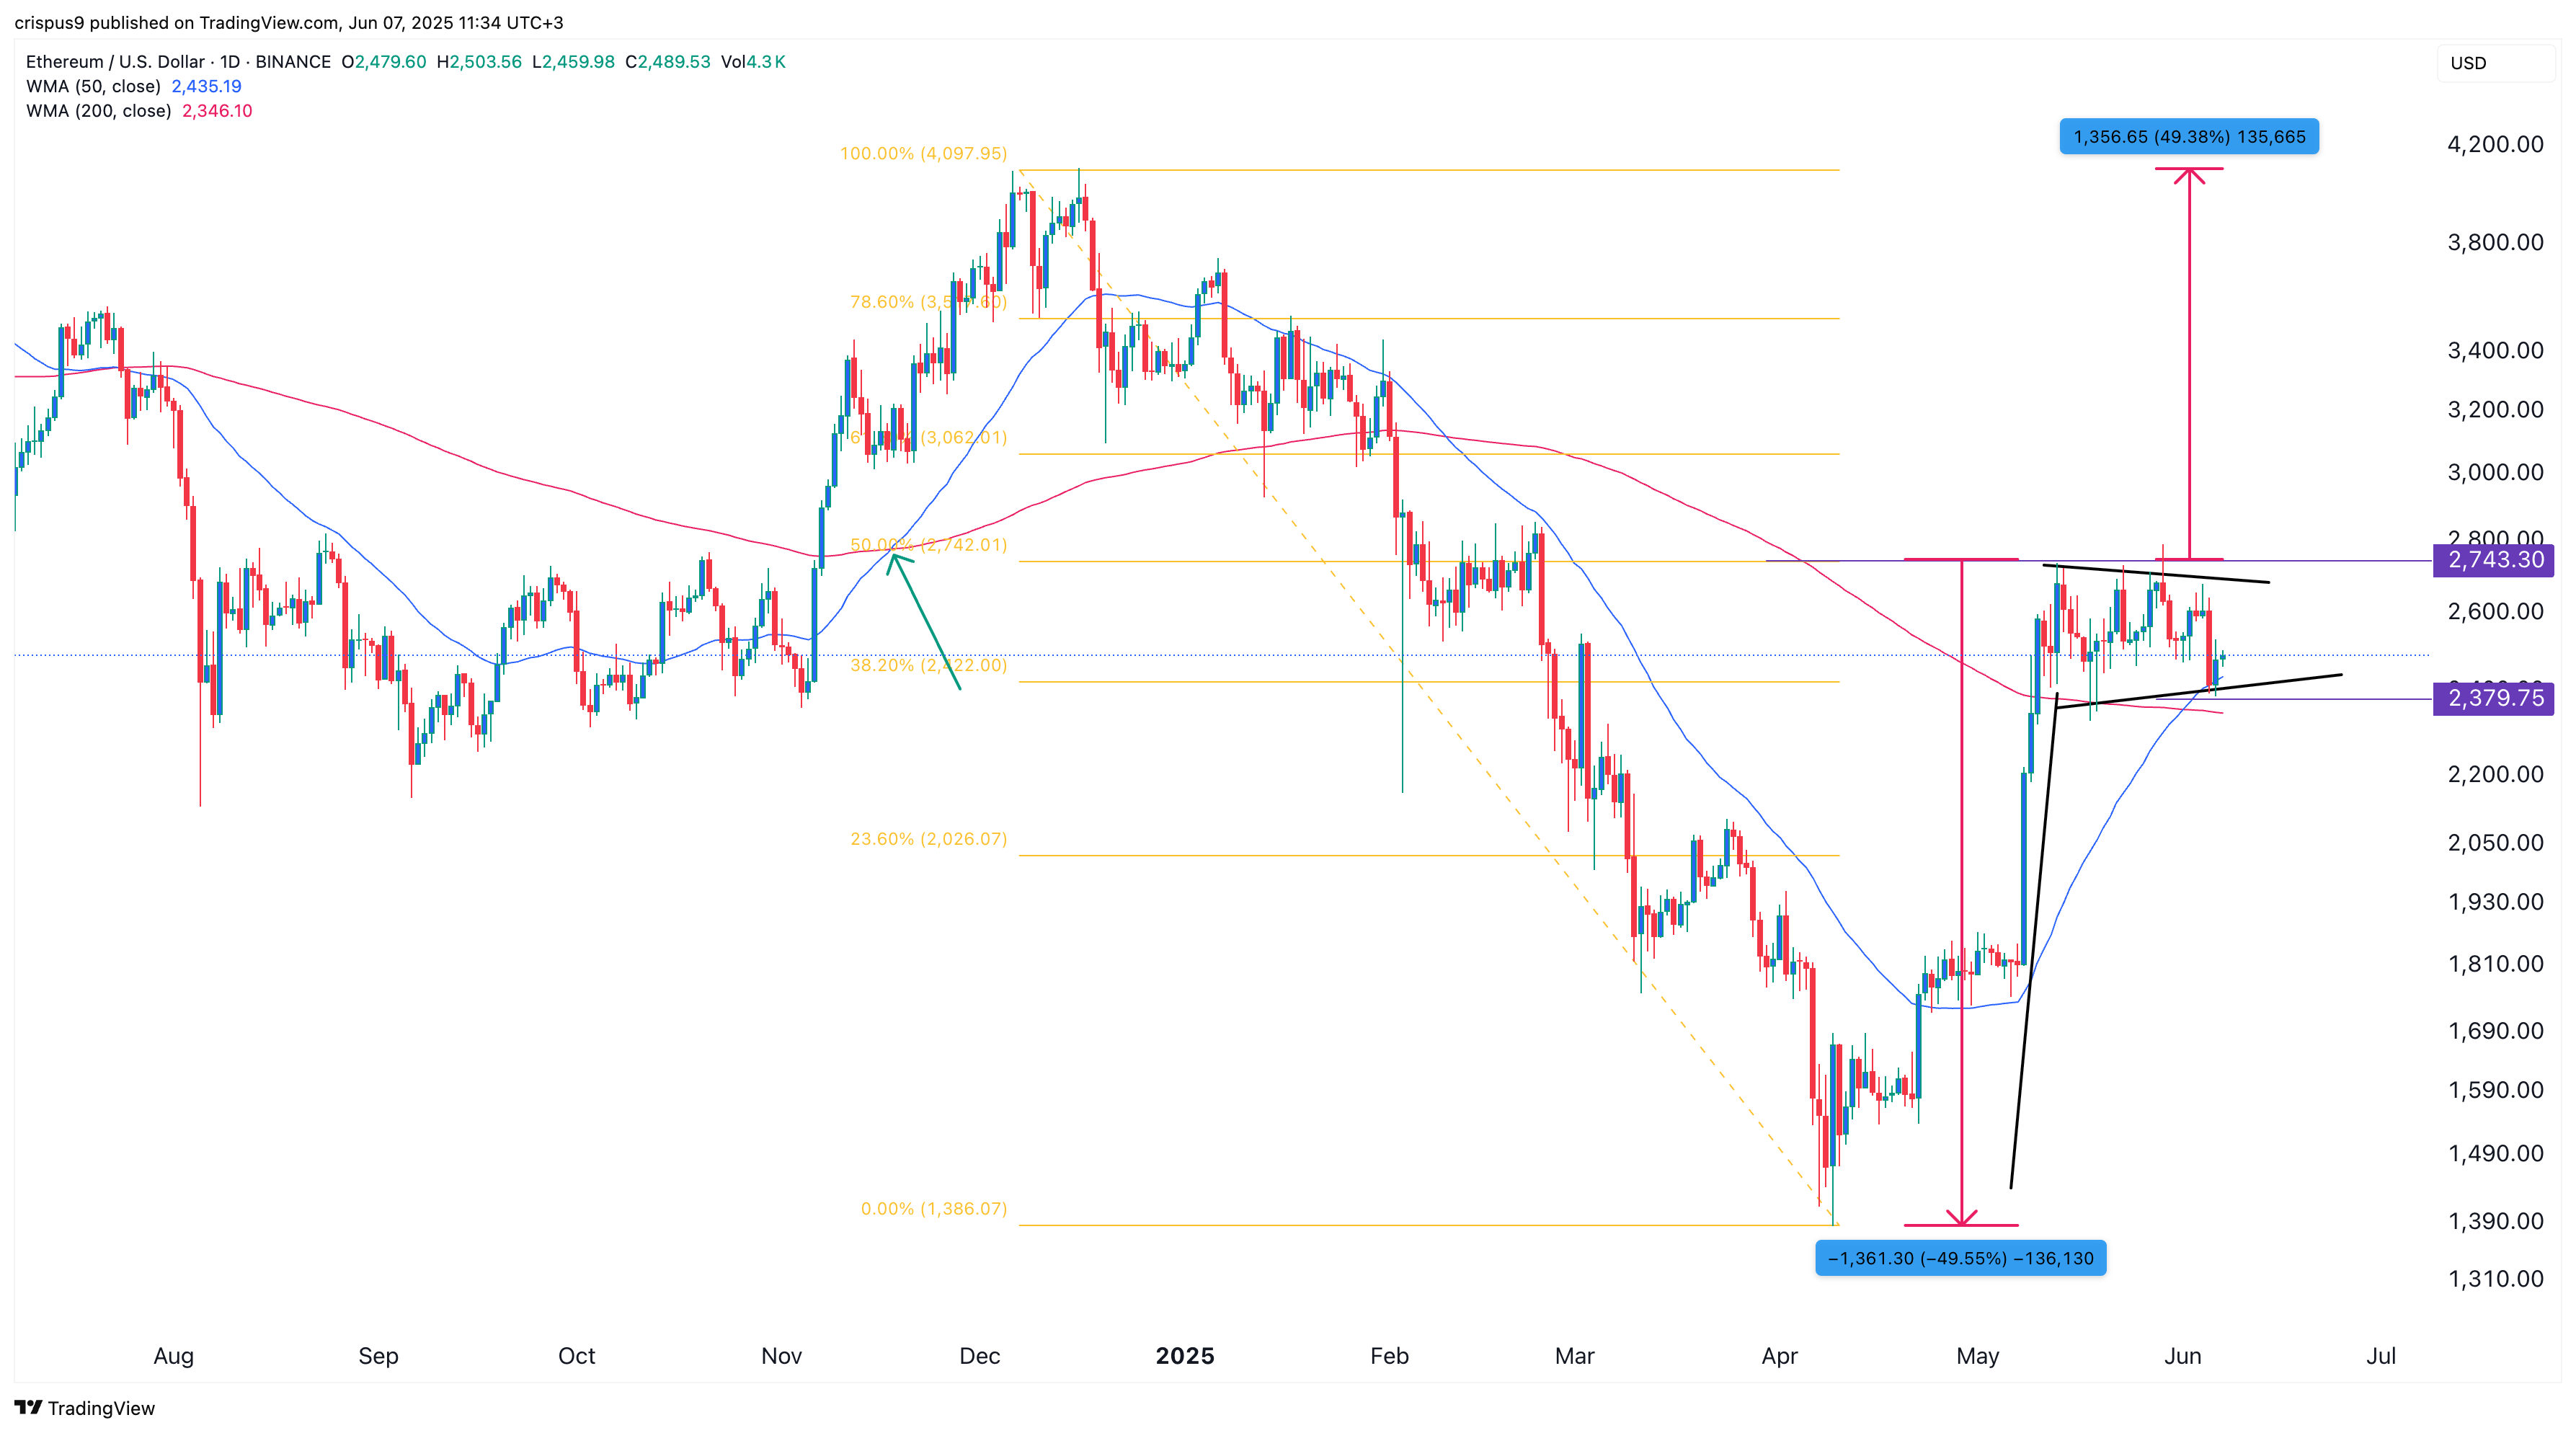
The daily chart shows that ETH price surged in May and reached a high of $2,743, which coincided with the 50% Fibonacci Retracement level.
It has now formed a bullish flag pattern, a common bullish continuation sign. This flag pole is about 50% long, and measuring the distance from its breakout zone gives the target price of $4,097. This target coincided with its highest point in 2024.
The other bullish case is that Ethereum price has formed a golden crossover as the 50-day and 200-day Weighted Moving Averages have crossed each other. This crossover often leads to more gains. For example, it happened in November last year, triggering a 35% jump.


