Ethereum Whales Relentlessly Selling For 6 Months, Data Says
On-chain data shows the Ethereum whales have been participating in constant distribution for the last six months, a sign that’s not ideal for ETH.
Ethereum Accumulation Trend Score Has Been Red For Cohorts As A Whole
As analyst James Van Straten pointed out in a new post on X, the Accumulation Trend Score has been showing a grim picture for Ethereum recently. The “Accumulation Trend Score” here refers to an indicator from Glassnode that tells us whether the investors of a given asset are accumulating or not.
This metric takes into account for not just the net balance changes happening in the wallets of the investors, but also the size of the entities. This means that larger entities have a higher weight in the indicator. When the value of the score is close to 1, it means either the large investors are participating in strong accumulation or a large number of small holders are buying. On the other hand, it being close to 0 implies net distribution is going on in the network or at least, there is a lack of accumulation taking place.
In the context of the current topic, the version of the Accumulation Trend Score that’s of interest is the one for the individual cohorts. Addresses have been divided into these groups based on the balance that they are carrying.
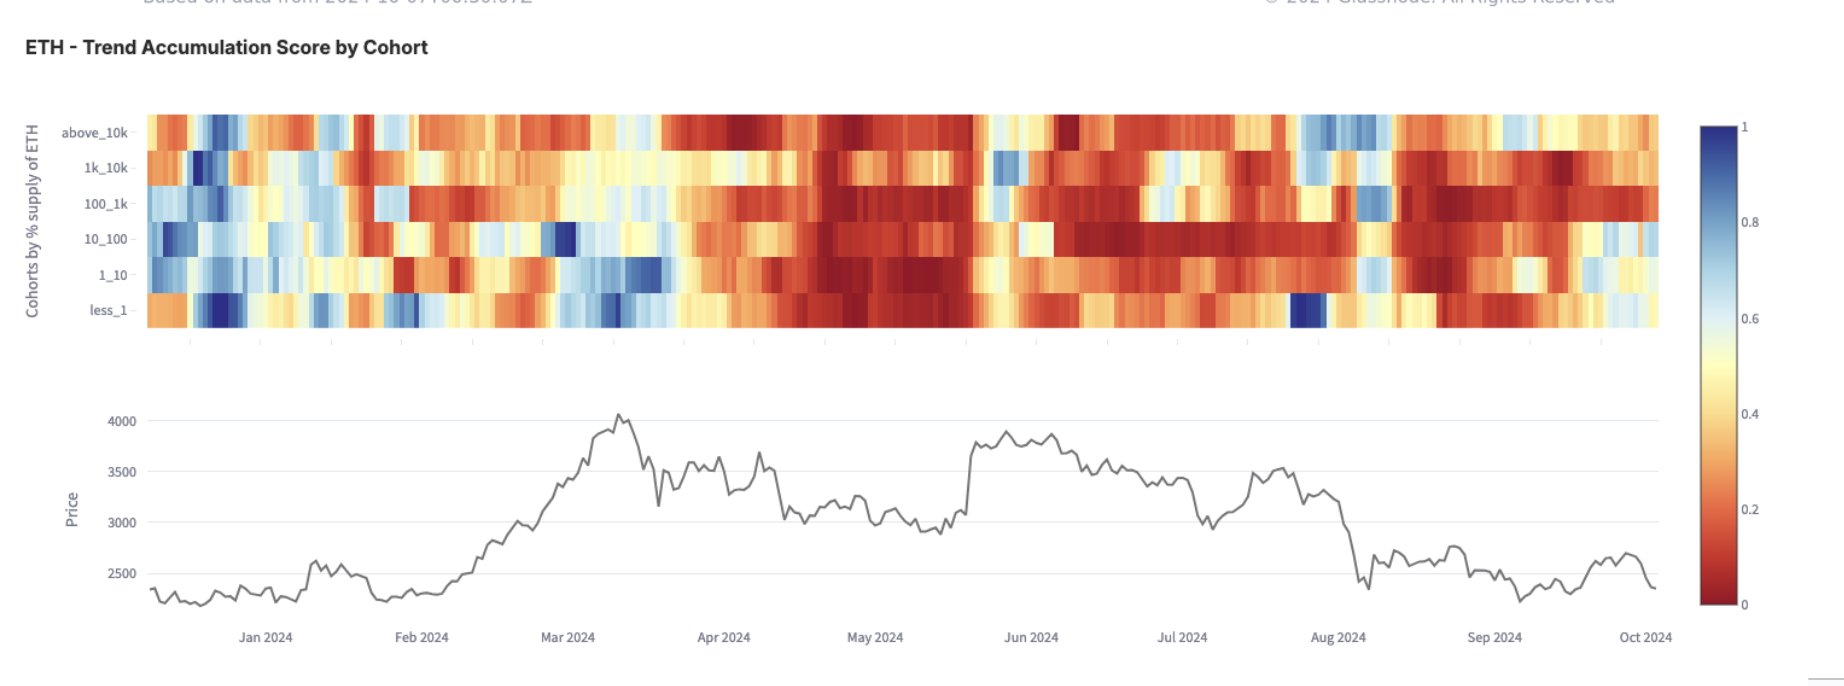
Now, here is a chart that shows the trend in the Ethereum Accumulation Trend Score for the different cohorts over the past year:
The value of the metric appears to have been red for most of the cohorts recently | Source: @btcjvs on X
As displayed in the above graph, the Ethereum Trend Accumulation Score showed a shade of blue across the cohorts during the early parts of the year, implying the investors as a whole were participating in some degree of accumulation.
Shortly after the Bitcoin all-time high (ATH) back in March, however, the investors started aggressively selling, with the indicator’s value taking a deep red color (that is, very close to the zero mark). Since the initial sharp distribution, selling has calmed down over the last few months, but the metric has still been tending towards being red. Of note, the 100 to 1,000 BTC, the 1,000 to 10,000 BTC, and the 10,000+ BTC groups are still in a phase of distribution.
These cohorts are popularly referred to as, in the same order, sharks, whales, and mega whales. Investors of this size can carry some degree of influence in the market, so their participation in consistent selling over the last six months or so is naturally not a good sign for Ethereum.
It’s possible that until the various cohorts return back to accumulation mode, ETH won’t be able to make any significant recovery.
ETH Price
At the time of writing, Ethereum is floating around $2,400, down more than 7% over the last seven days.
Looks like the price of the coin has been moving sideways over the last few days | Source: ETHUSDT on TradingView
Featured image from Dall-E, Glassnode.com, chart from TradingView.com

