Injective flips key resistance as open interest hits 3-month high
Injective, a Mark Cuban-backed layer-1 network, bounced back, rising to its highest level in over two months as whale activity increased.
Injective (INJ) token jumped to $24.87 on Tuesday, Oct. 1, up by 10% from its lowest level in August. The token’s rally happened as the futures open interest of the token jumped to its highest point since June 14.
It had an open interest of over $127 million, most of which was in Binance, followed by Bitmex, Bybit, and OKX. The interest was also substantially higher than the September low of $67 million.
Open interest is an essential metric in the crypto industry because it shows the amount of outstanding futures contracts in exchanges. A higher interest level can indicate that a crypto asset is more liquid and in significant demand.

Meanwhile, data from Santiment shows that whale activity in Injective has increased in the past few days. It had a 456% increase in whale activity, indicating that these participants are becoming bullish on the coin.
Injective also rose as the number of on-chain transactions in its network jumped to over 995 million.
Last week, the network also joined the Tokenized Asset Coalition, which includes companies like Coinbase and Circle.
The main challenge for Injective is that its ecosystem growth has been weaker than other popular layer-1 networks like Sui (SUI), Tron (TRX), and Solana.
According to DeFi Llama, Injective has a total value locked of over $44 million, down from an all-time high of over $77.6 million. Helix, its biggest decentralized exchange, has just $31 million in assets and handled $31 million in transactions in the last 24 hours.
Injective crossed two key resistance levels
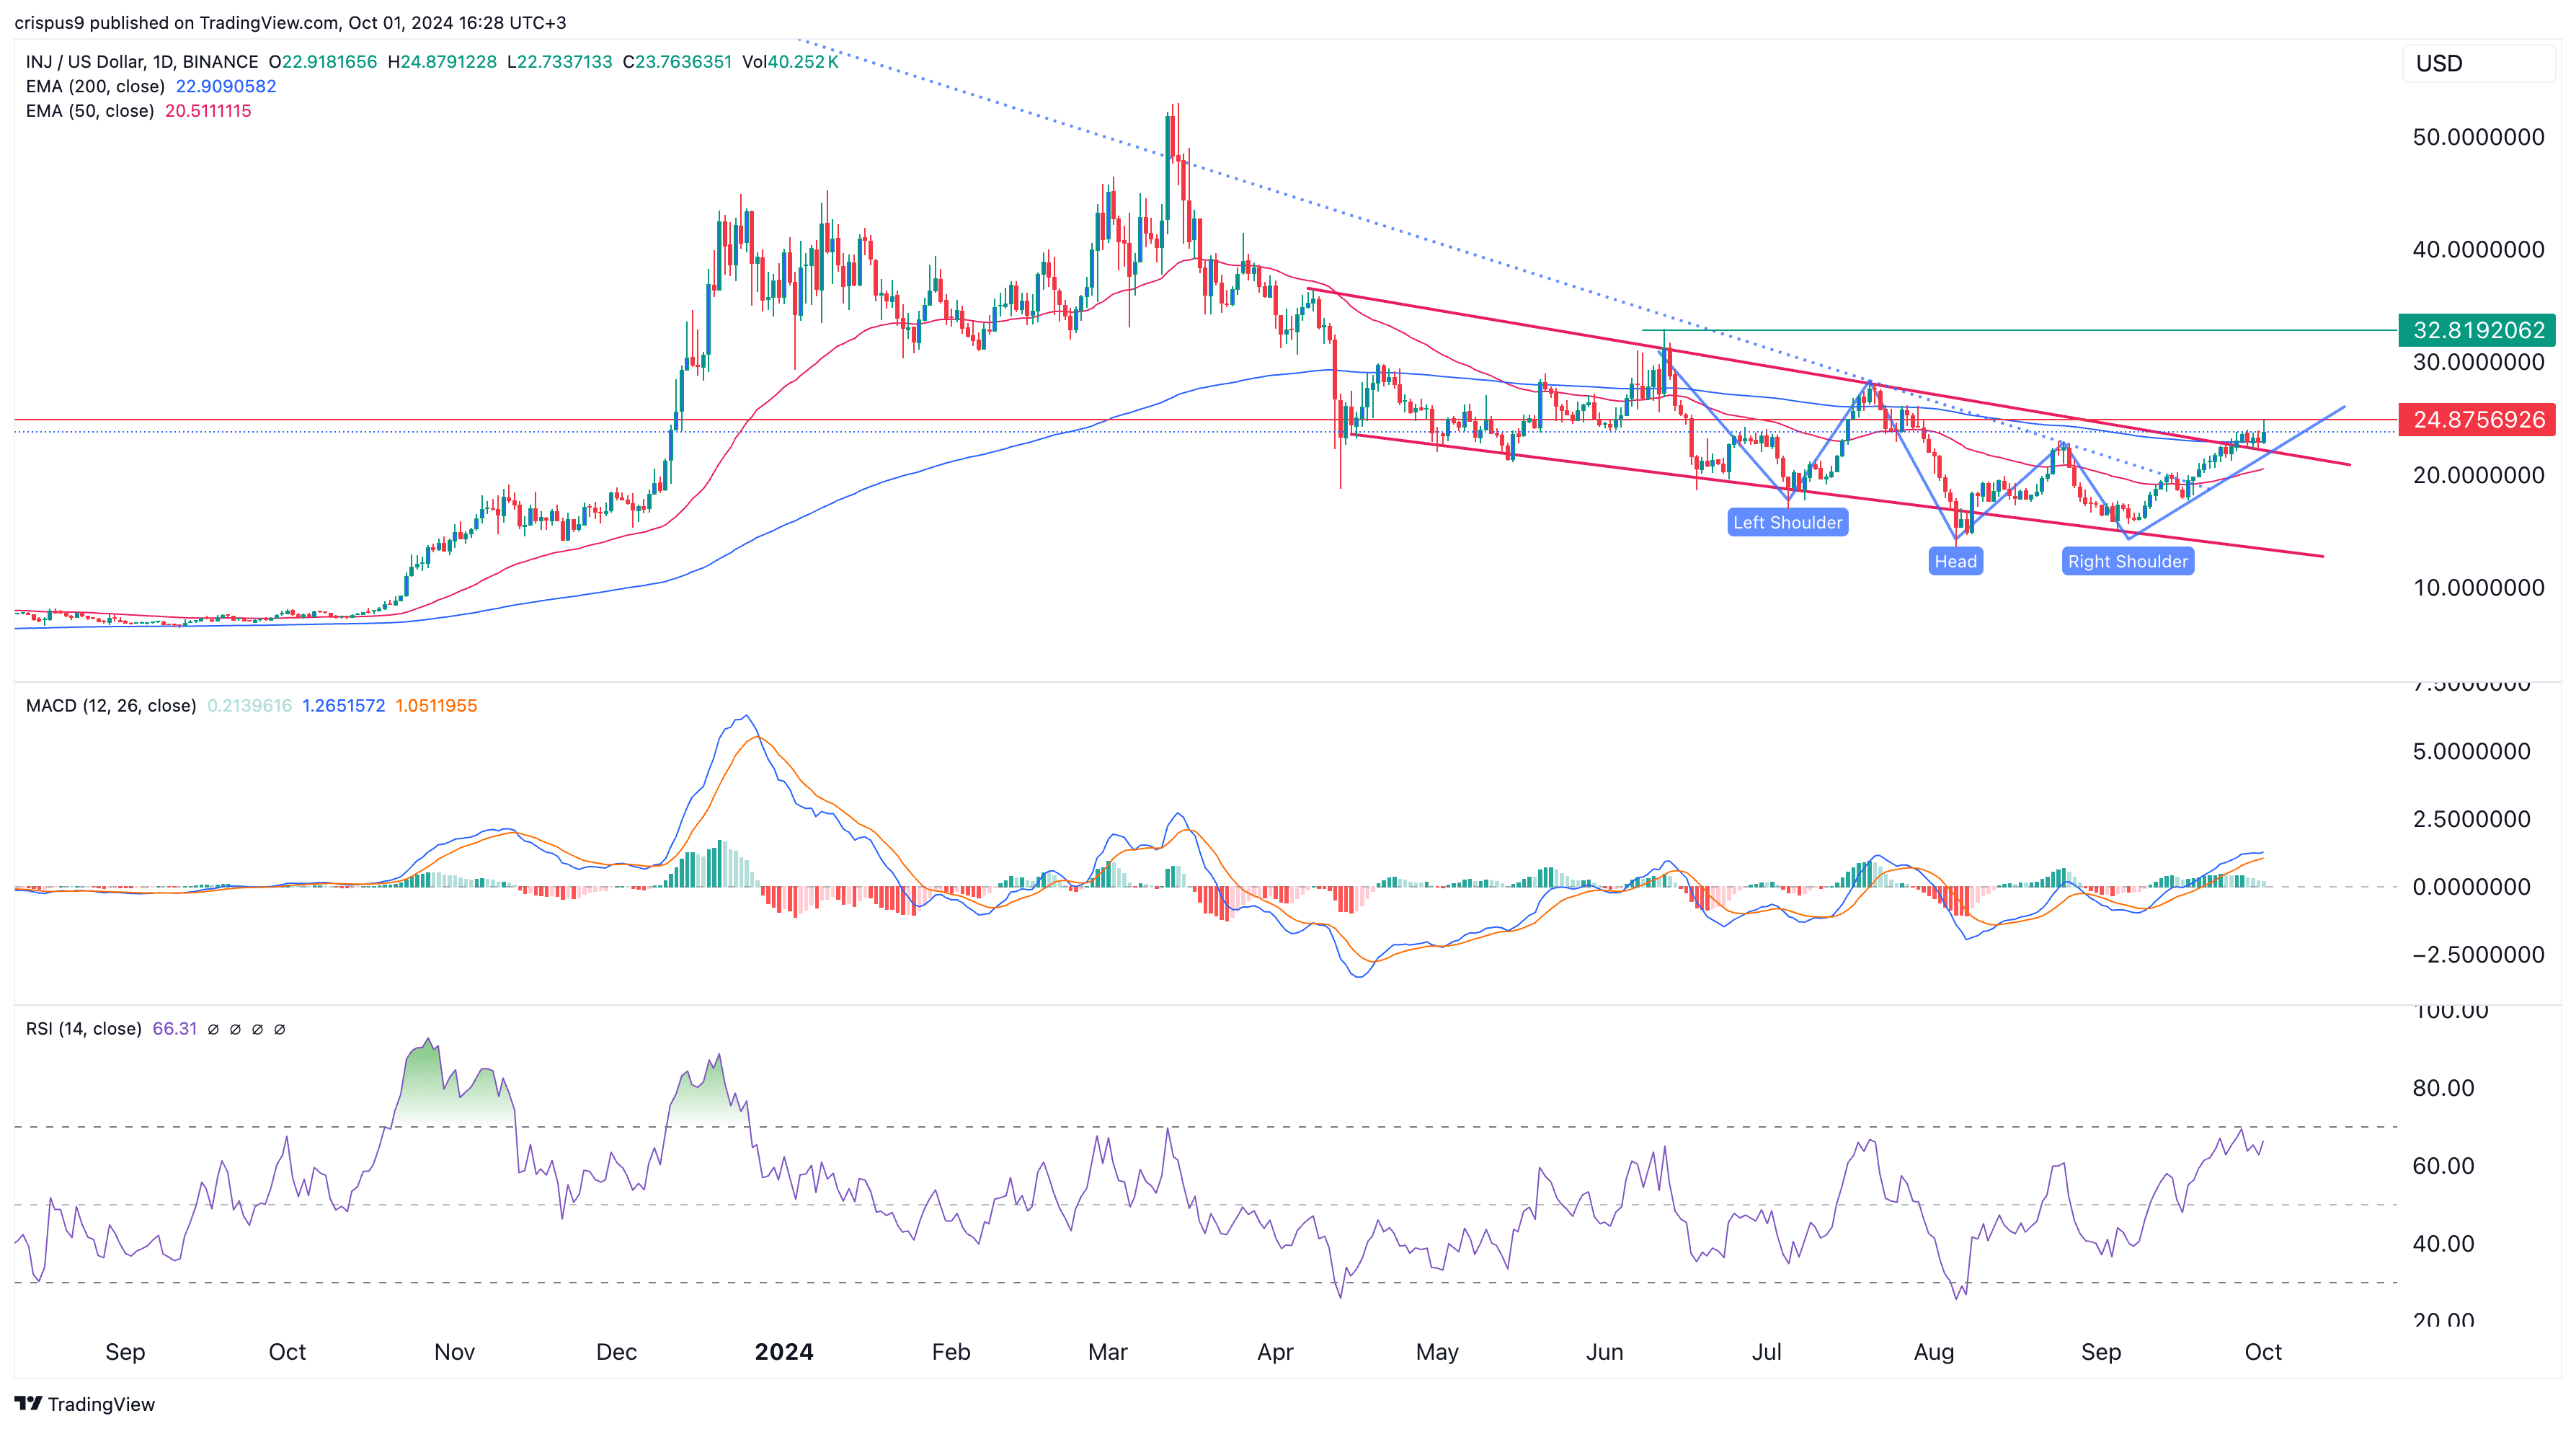
Injective has soared above the 200-day Exponential Moving Average on the daily chart, which is often a positive sign.
It also rose above the upper side of the descending channel pattern that connects the highest swings since April 8.
The two lines of the MACD indicator moved above the zero line, while the Relative Strength Index approached the overbought level of 70. It has also formed an inverse head and shoulders pattern, pointing to more upside in the near term. If this happens, the next point to watch will be $32.81, its highest level on June 12.

