rally to $5 likely as RLUSD nears $700m milestone
XRP price remained in a local bear market this week after plunging by 20% from its highest point this year.
Summary
- XRP price has crashed by 20% from its highest level this year.
- The Ripple USD stablecoin is nearing $700 million market cap.
- Technical analysis points to more gains, potentially to $5.
Ripple (XRP) token was trading at $2.90 on August 21, but the ongoing stablecoin growth and bullish technicals indicate an eventual rebound to $5 and beyond.
Ripple USD is nearing a $700 million milestone
One potential catalyst for the XRP price is that its stablecoin growth is accelerating. CoinMarketCap data shows that Ripple USD (RLUSD) has attained a market capitalization of over $666 million, much higher than the $527 million it had in the same period last month.
This growth has made it the third-largest stablecoin regulated in the United States, after USD Coin (USDC) and PayPal USD. The momentum will likely surge now that the US has passed the GENIUS Act.
More data shows that individuals and institutions are using RLUSD. According to Artemis, the number of transactions in the last 30 days jumped to 413,000, while the transaction volume rose by 53% to $2.7 billion.
One of these transactions was on the recent Bullish IPO. Unlike other companies going public, Bullish opted to receive its funds using a combination of stablecoins, including RLUSD. Stablecoins are faster and more cost-effective than other options.
There is a likelihood that the RLUSD stablecoin will be used in the upcoming Gemini IPO. Ripple Labs recently extended a $75 million credit line to the company, in a deal that likely involved RLUSD.
XRP price will likely benefit from the ongoing RLUSD stablecoin growth because it will lead to more activity in the XRP Ledger, attracting fees.
The other potential catalyst for the XRP price is that the SEC will likely approve the ten ETFs that have been filed by companies like Franklin Templeton and Bitwise.
XRP price technical analysis

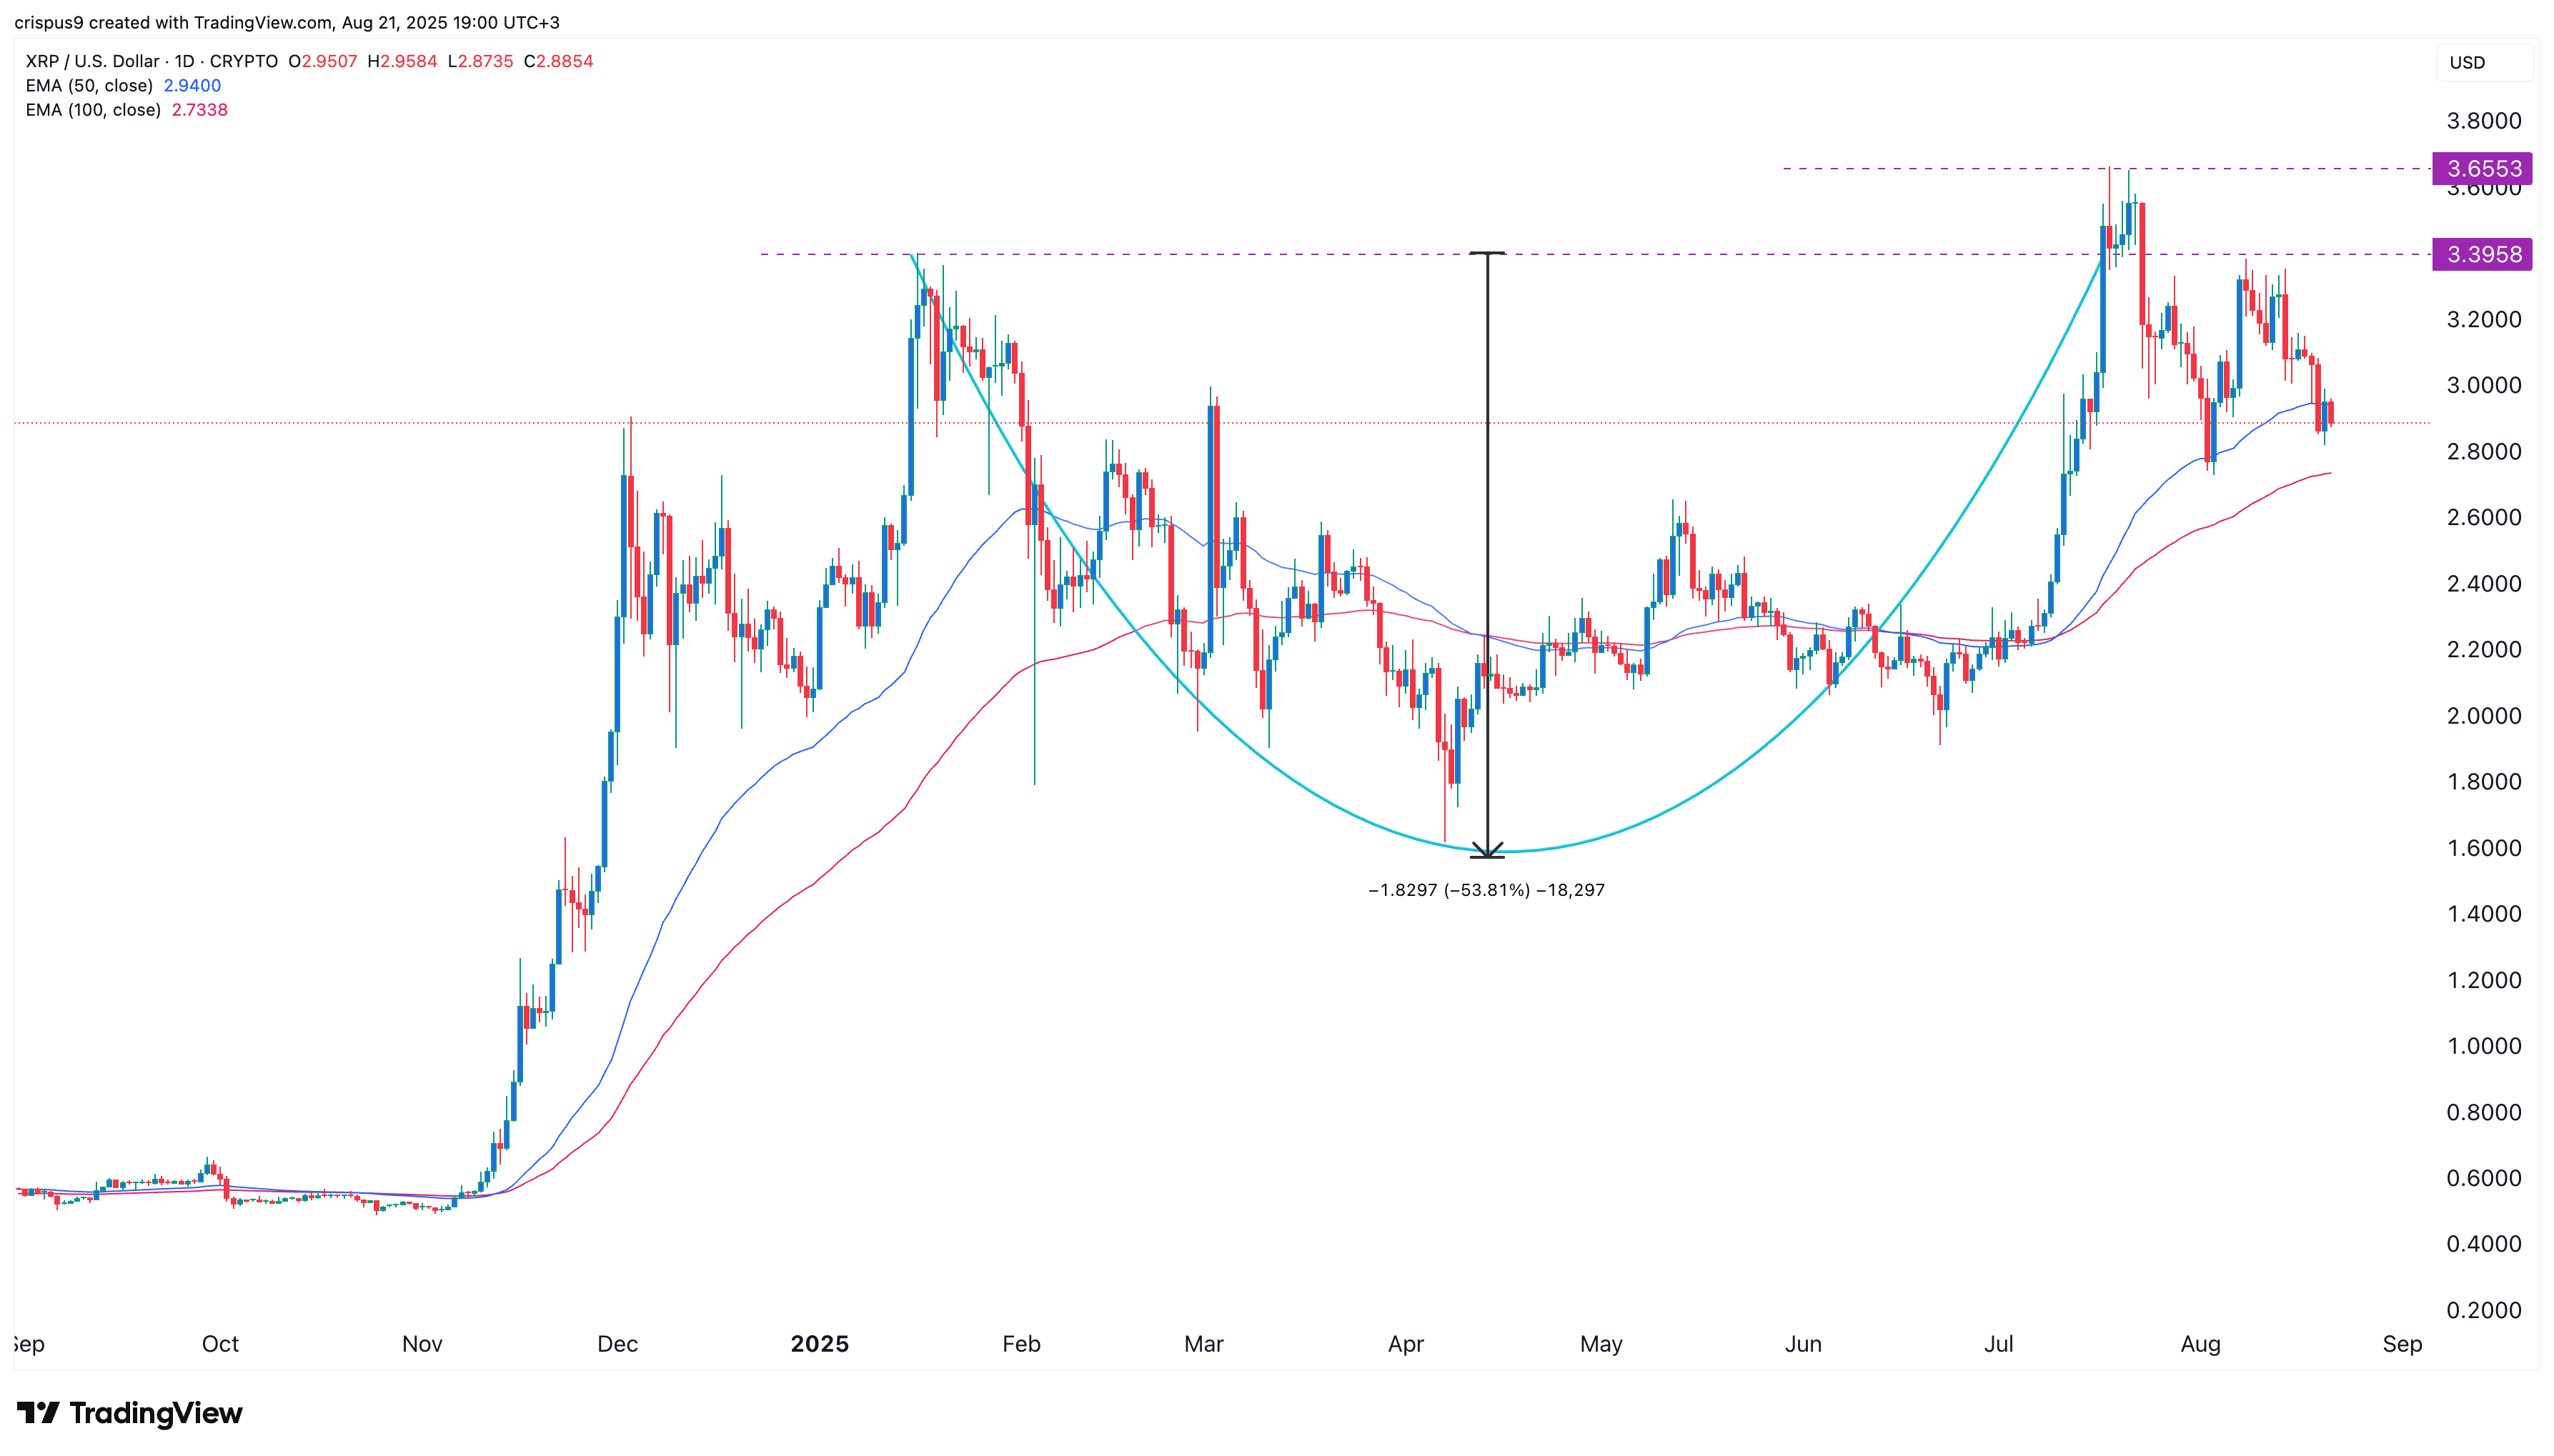
The daily timeframe chart shows that the XRP price has moved downward in the past few weeks. It has crashed from a high of $3.6553 on July 18 to the current $2.88.
The ongoing pullback is part of the handle section of the cup-and-handle pattern whose depth is about 52%. Therefore, measuring the same distance from the cup’s upper side points to an eventual surge to above $5.
The bullish view is supported by the fact that it has remained above the 50-day and 100-day moving averages.


