After the recent surge in Bitcoin’s price and the successful breakout above the significant $30K resistance level, the market is now undergoing a period of consolidation. However, noteworthy signals are emerging during this phase.
Technical Analysis
By: Edris
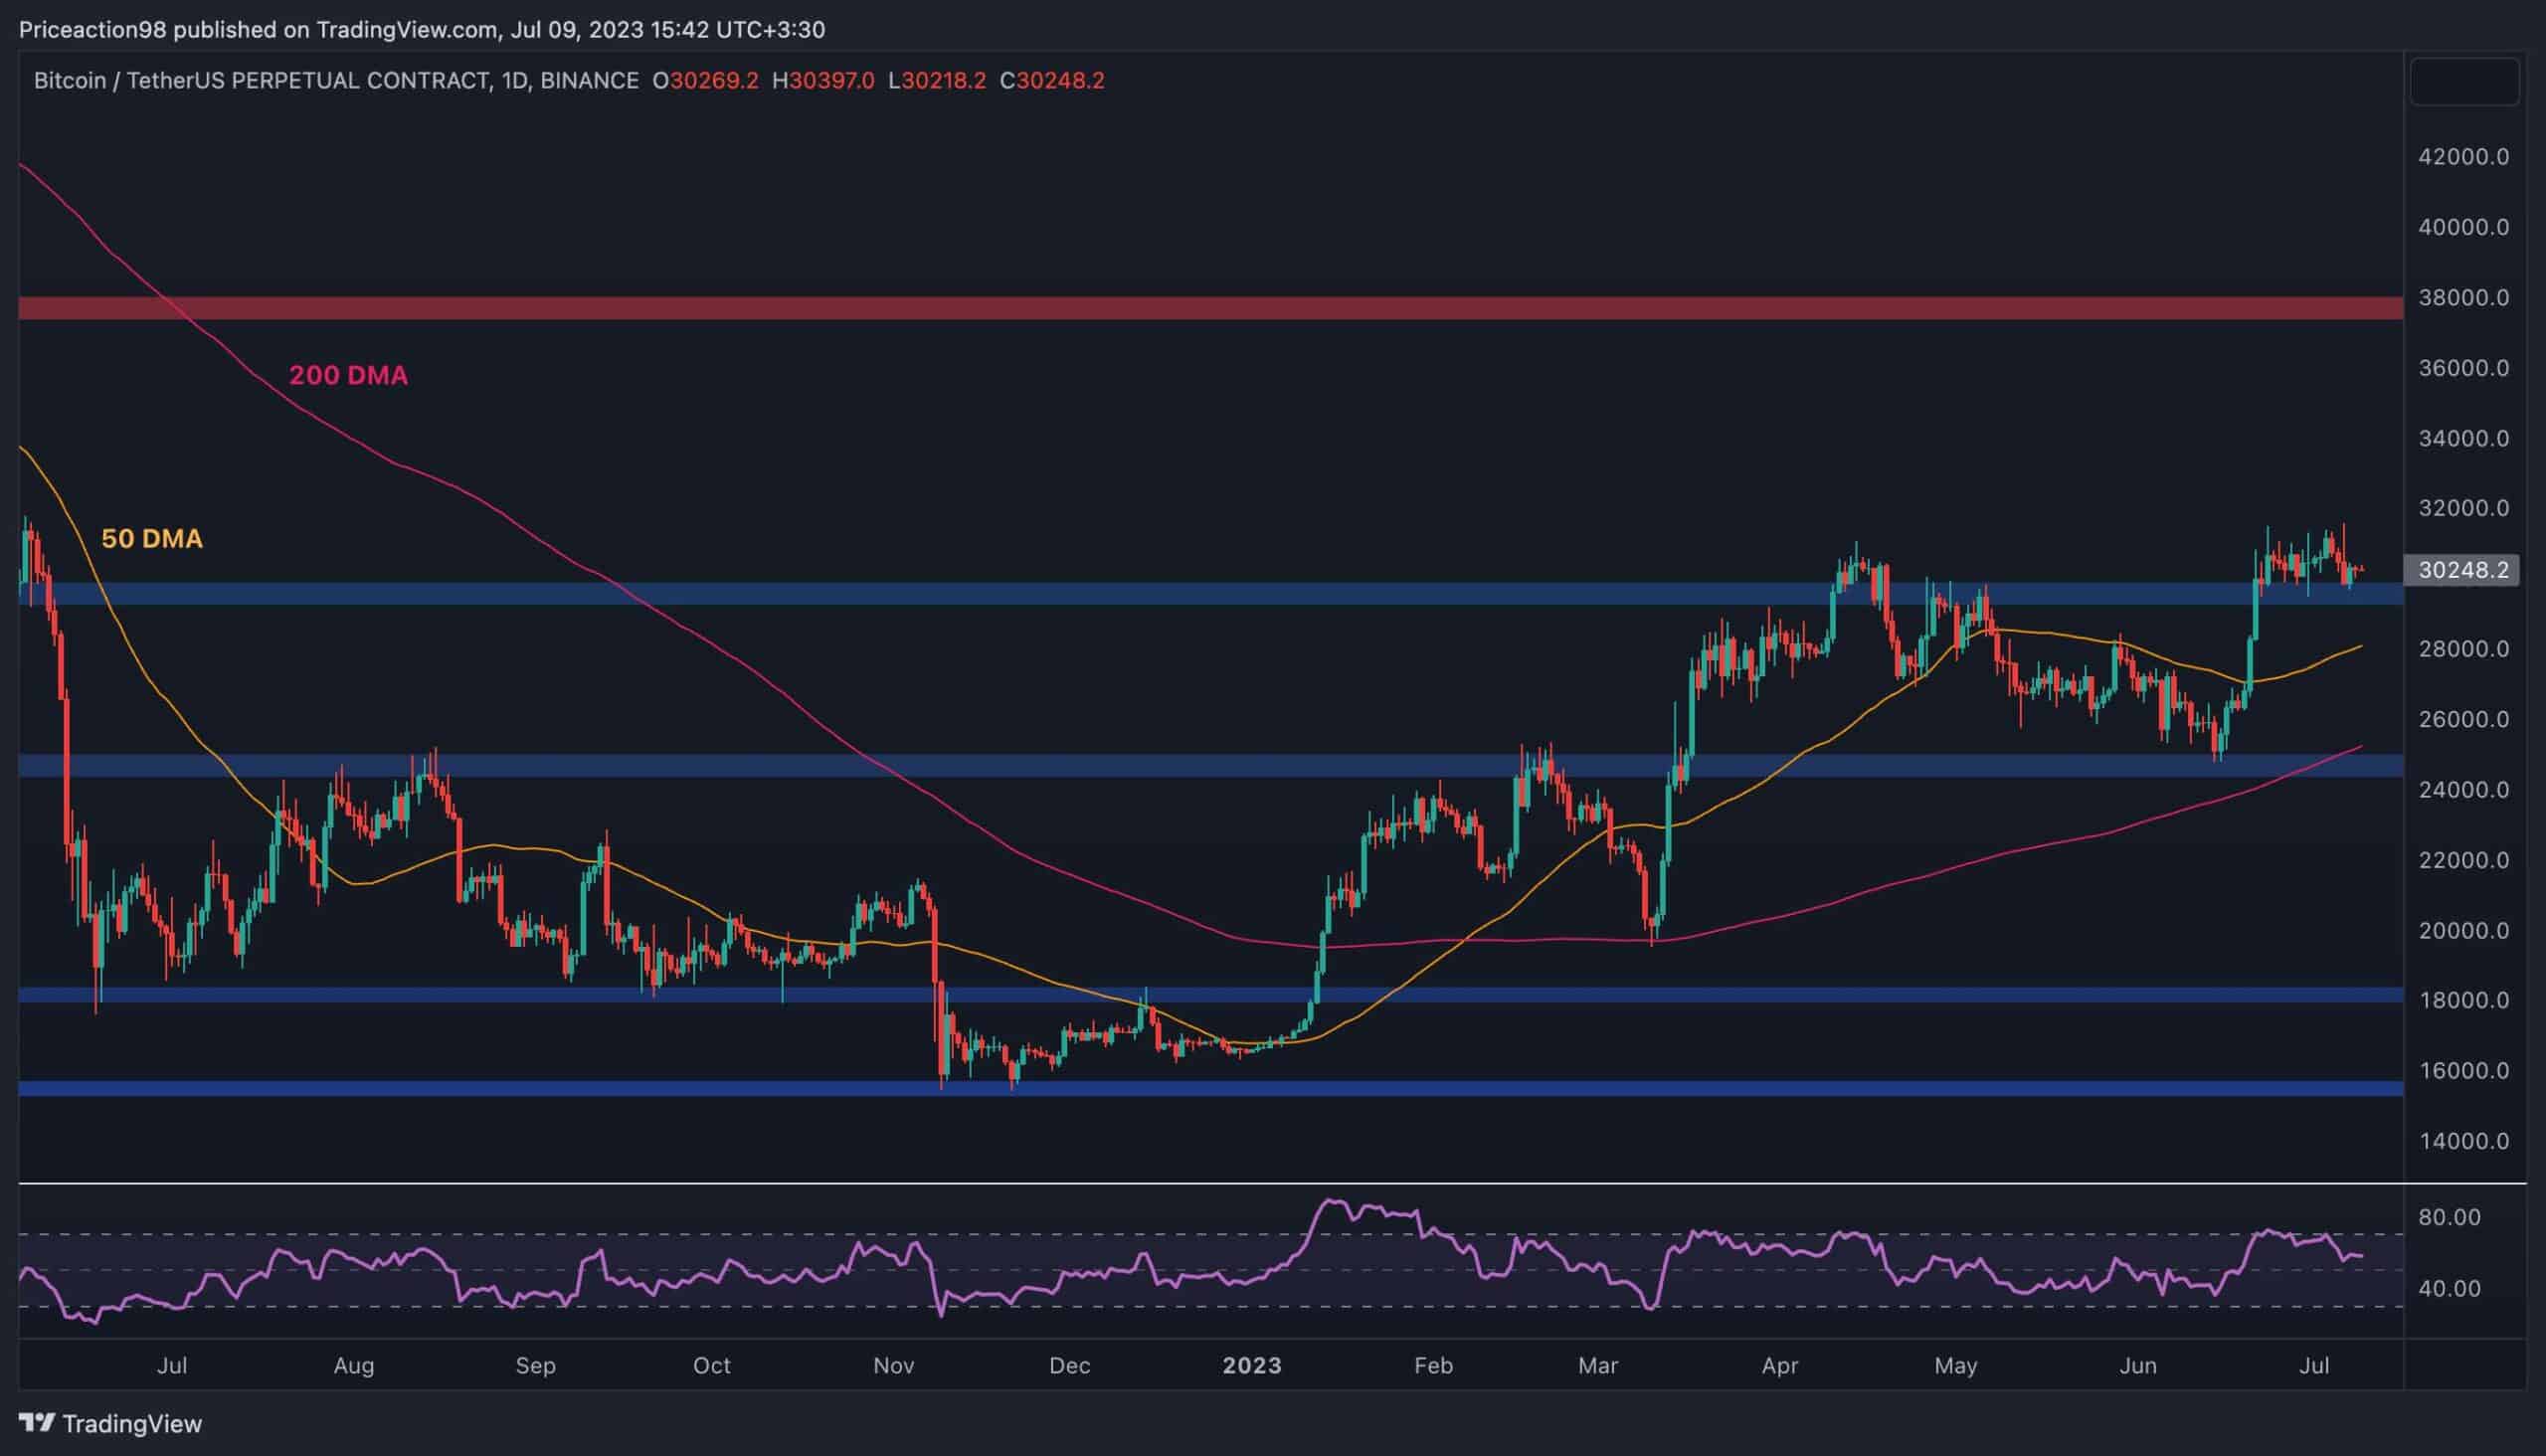
The Daily Chart:
On the daily chart, the price has repeatedly tested the $30K level since breaking above it recently. While this level has provided support so far, there are concerning indications in the form of a bearish divergence seen in the RSI indicator.
This suggests the possibility of a correction or reversal in the near term. Should a decline occur, the 50-day and 200-day moving averages at approximately $28K and $26K marks, respectively, could act as significant support levels.
Conversely, if the price continues its upward momentum, a move toward the $38K resistance zone becomes a plausible scenario.

The 4-Hour Chart:
On the 4-hour chart, the price has displayed erratic and unpredictable movements in recent weeks, making it difficult to determine its future direction. The $30K level is being tested once again, and a potential breakdown could result in a decline toward the $27,500 level.
The RSI indicator has been relatively flat, hovering around the 50% mark, suggesting a lack of clear dominance from buyers or sellers. The ongoing battle near the critical $30K area further reinforces the short-term uncertainty in the market.

On-chain Analysis
By: Edris
Bitcoin Exchange Reserve
The recent upward movement in Bitcoin’s price has sparked discussions regarding whether market participants are selling their coins for minimal profit or opting to hold onto them longer.
By analyzing the Bitcoin exchange reserve metric, which tracks the amount of BTC held in exchange wallets, we can gain insights into investor behavior. An increase in this metric indicates that investors are depositing their coins onto exchanges, likely intending to sell them. Conversely, a decrease suggests that investors are withdrawing their BTC from exchanges, indicating a preference to hold onto their coins for an extended period.
Recent data shows a significant decline in the Bitcoin exchange reserve metric over the past month. This decline suggests a bullish sentiment among market participants, as they anticipate further price increases and are inclined to hold onto their coins.

Binance Free $100 (Exclusive): Use this link to register and receive $100 free and 10% off fees on Binance Futures first month (terms).
PrimeXBT Special Offer: Use this link to register & enter CRYPTOPOTATO50 code to receive up to $7,000 on your deposits.
Disclaimer: Information found on CryptoPotato is those of writers quoted. It does not represent the opinions of CryptoPotato on whether to buy, sell, or hold any investments. You are advised to conduct your own research before making any investment decisions. Use provided information at your own risk. See Disclaimer for more information.
Cryptocurrency charts by TradingView.