Ripple’s price has been mostly bearish over the past few weeks following a rejection from the critical resistance level of $0.9. XRP has also been trending in the negative territory compared to BTC (XRP / BTC).
Technical Analysis
By Edris
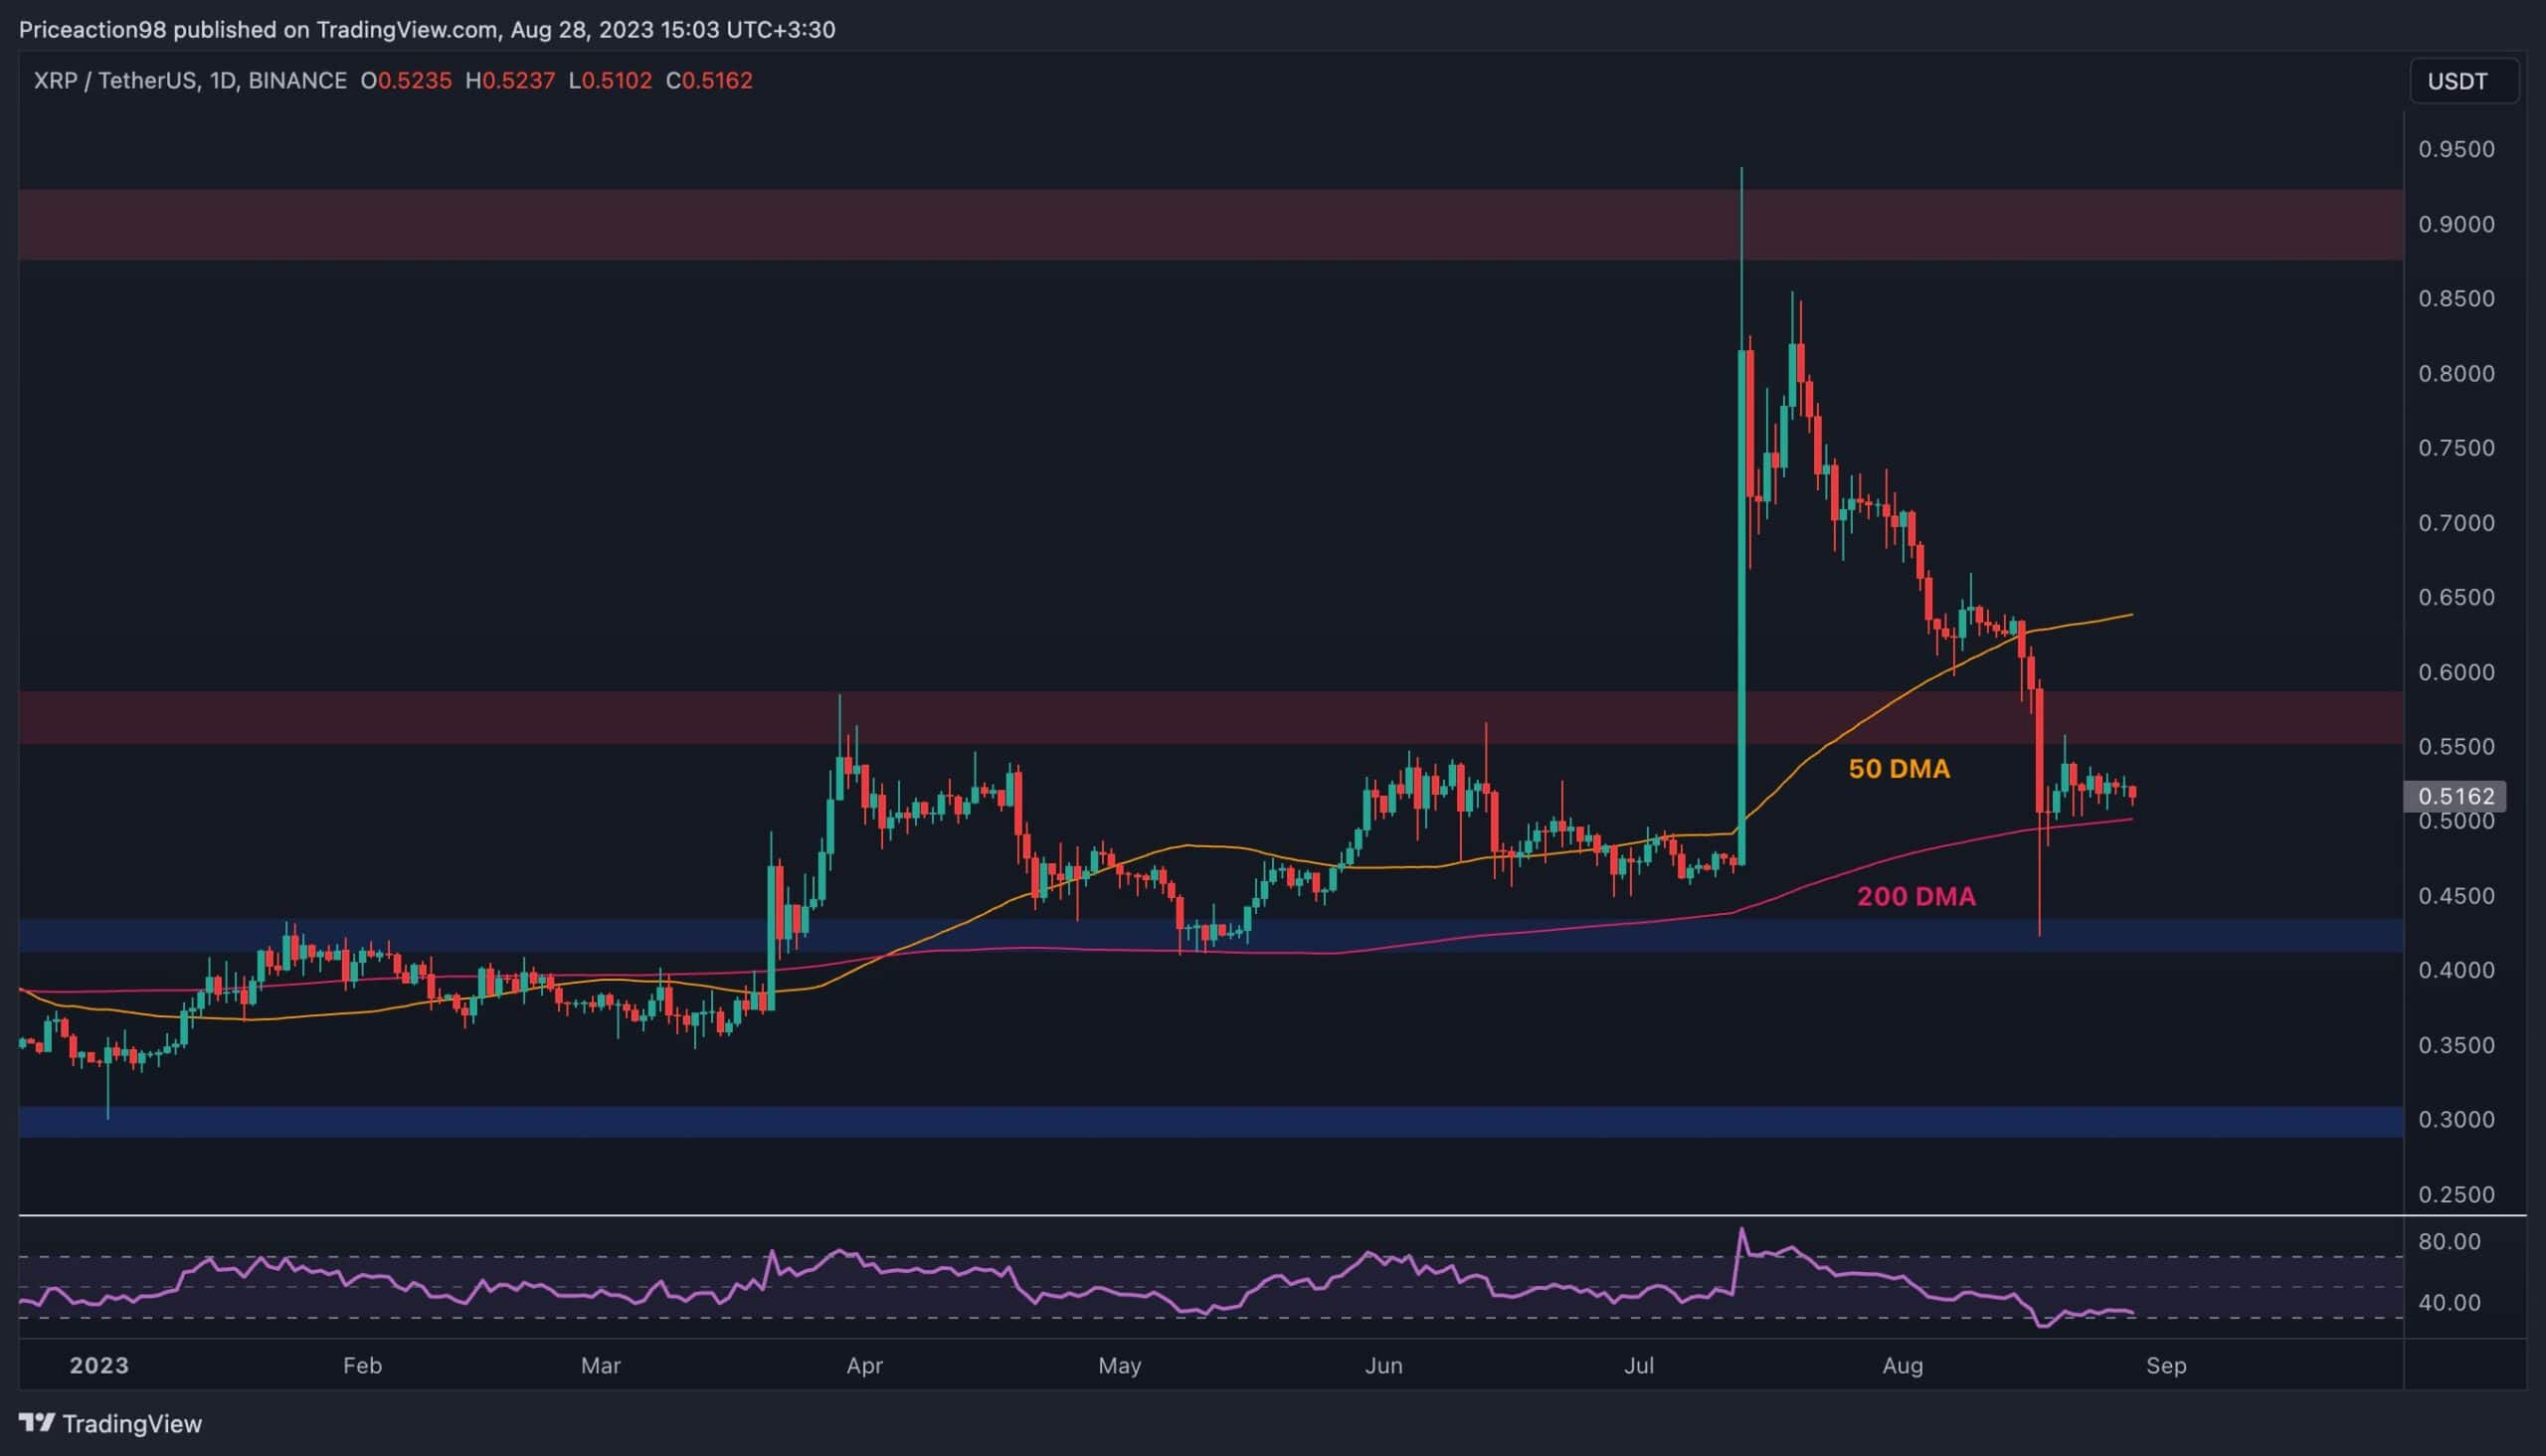
The XRP-USDT Chart
On the USDT-pair chart, XRP has been dropping rapidly lately. The 50-day moving average, located around the $0.63 mark, and the static $0.55 level have been broken to the downside following significant momentum and volume. Currently, the market is consolidating above the 200-day moving average near the $0.5 level, and the price has yet to close below it.
Considering RSI’s recovery from the oversold region, a bullish pullback to retest the $0.55 support turned resistance level, or even the 50-day moving average is probable. However, the trend remains bearish, and lower prices can be expected in the coming weeks.

The XRP-BTC Chart
Looking at the BTC pair, things look pretty similar. XRP’s price has dropped below key support levels and ranges between the 200-day moving average and the 50-day moving average, trending around the 1800 SAT and 2200 SAT levels, respectively.
A breakout from this range will likely determine Ripple’s short-term price action. Yet, as the market structure suggests, a further bearish move seems more probable, with the RSI showing values below 50%.

Binance Free $100 (Exclusive): Use this link to register and receive $100 free and 10% off fees on Binance Futures first month (terms).
PrimeXBT Special Offer: Use this link to register & enter CRYPTOPOTATO50 code to receive up to $7,000 on your deposits.
Disclaimer: Information found on CryptoPotato is those of writers quoted. It does not represent the opinions of CryptoPotato on whether to buy, sell, or hold any investments. You are advised to conduct your own research before making any investment decisions. Use provided information at your own risk. See Disclaimer for more information.
Cryptocurrency charts by TradingView.