ZORA drops 33% as whale accumulation signals potential bullish turnaround
Zora’s price declined for the fourth straight day on Thursday, falling sharply from its recent near-record high. With whales stepping in to accumulate, could the token be poised for a rebound soon?
Summary
- ZORA price dropped nearly 33% from its weekly high level.
- Whale wallet balances for the altcoin have increased in the past 24 hours.
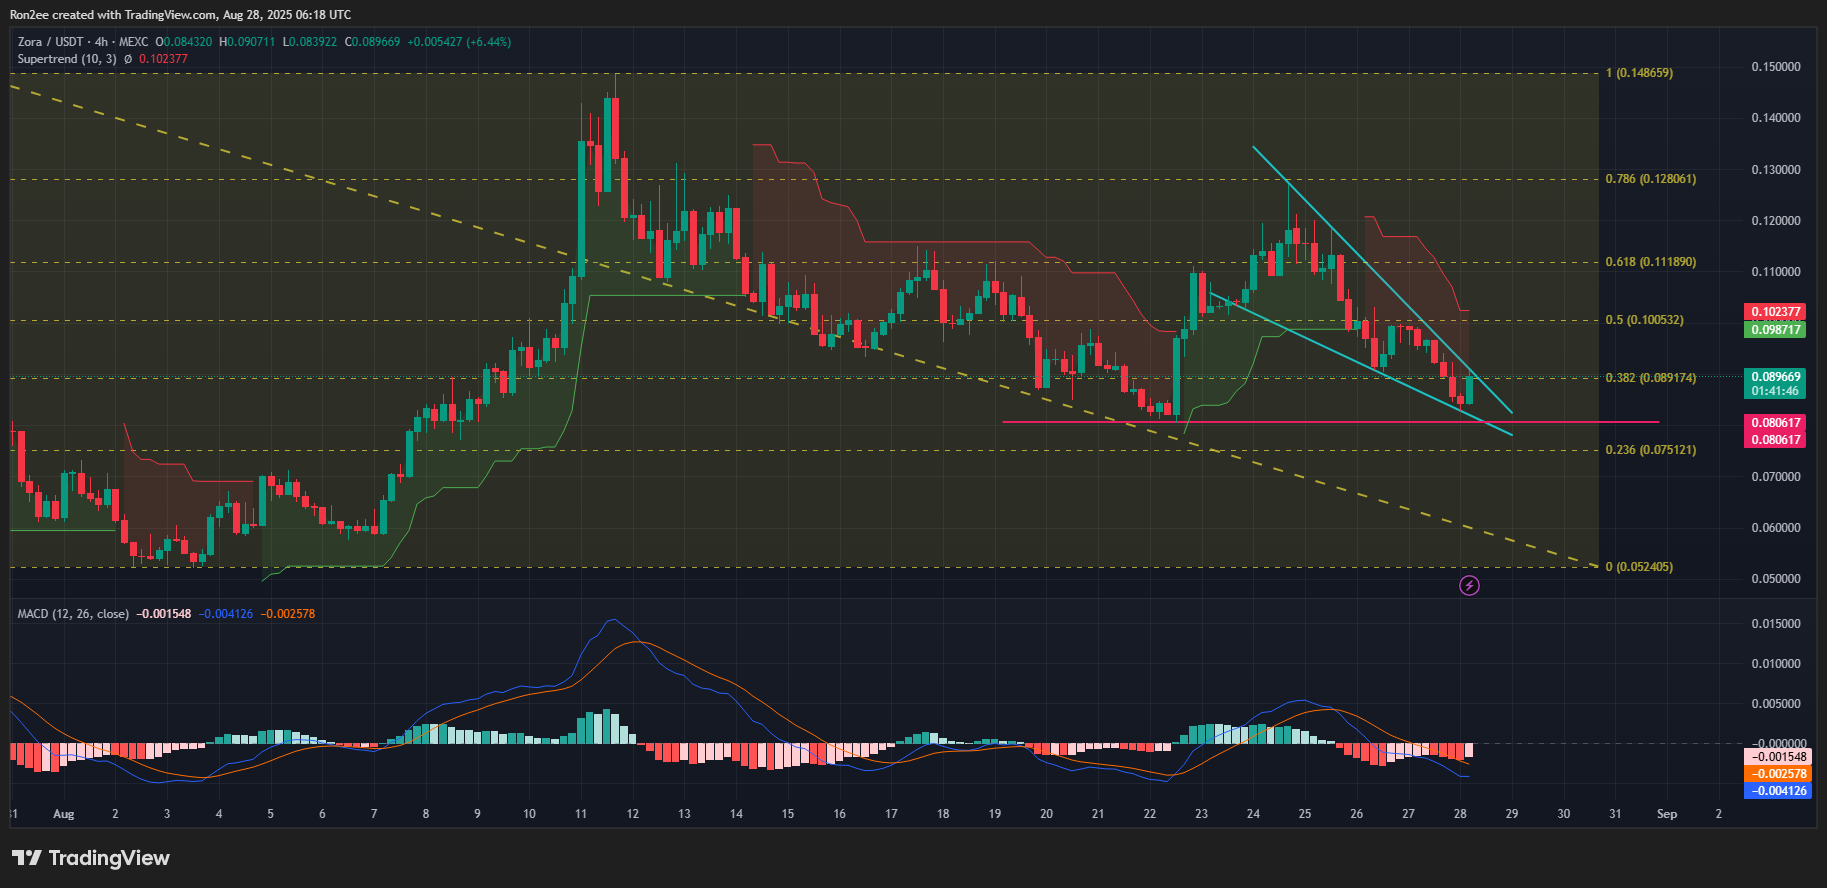
- The token has been trading within a falling wedge on the 4-hour chart.
According to data from crypto.news, Zora (ZORA) dropped 14% to an intraday low of $0.083 on Aug. 28, morning Asian time. At that price, the token remains 33% below its weekly high reached earlier on Monday, which had been driven by Coinbase CEO Brian Armstrong’s purchase of BALAJIS, one of the creator coins within the Zora ecosystem.
While the token entered a downtrend shortly after the initial hype faded, falling short of surpassing its previous all-time high of $0.145 reached on Aug. 11, there are signs that ZORA could be poised for a bullish reversal soon.
Notably, the token has experienced renewed interest from whale investors amid its continued downtrend today. Data from blockchain analytics platform Nansen the total balances of ZORA tokens held by whale wallets have increased from 5.14 million to 9.55 million over the past 24 hours, marking an 86% jump in the period.

Such an increase in whale accumulation is often viewed as a buy signal by retail investors, who typically rush in to buy, driven by FOMO and the expectation of the related asset’s price appreciation in the short term.
If a similar scenario were to play out for ZORA, it could likely rebound from its recent downtrend soon.
On the 4-hour chart, Zora’s price has formed a falling wedge pattern over the past five days, a structure typically viewed as a bullish reversal signal. This pattern is characterized by converging downward-sloping trendlines that suggest weakening selling pressure over time.

As of press time, ZORA is approaching a breakout above the upper trendline near the $0.090 level. A confirmed move above this resistance could open the door to a short-term recovery.
However, technical indicators paint a more cautious picture. Notably, the Supertrend indicator has turned red and shifted above the current price, signaling ongoing bearish pressure and the possibility of a continued downtrend.
In addition, the Moving Average Convergence Divergence remains in bearish alignment, with the signal line positioned above the MACD line and both trending downward, indicating sustained negative momentum.
Given this setup, ZORA price is more likely to correct and move towards its local support at $0.080 before any meaningful rebound occurs.
That said, if ZORA confirms a clean breakout above the wedge pattern by the close of the current trading session, the token could potentially recover to $0.11, a level that coincides with the 61.8% Fibonacci retracement from its recent high. A sustained breakout beyond this level could pave the way for a retest of the Aug. 11 high at $0.145.
Disclosure: This article does not represent investment advice. The content and materials featured on this page are for educational purposes only.


